Dell Alienware AW3225QF

Introduction
32″ 4K OLED monitors are finally here! Dell were first to market in this segment in January 2024 with their Alienware AW3225QF, although that was only in North America, with the release in Europe and the UK coming later in February. We’ve actually now reviewed two other 32″ 4K OLED monitors in the form of the Asus ROG Swift PG32UCDM and MSI MPG 321URX before we had chance to get our hands on Dell’s screen, but we now have their model with us as well for testing and comparison.
Dell’s AW3225QF is a little different to all the other currently announced 32″ OLED monitors on the market in that it has a curved format, with a fairly subtle 1700R curvature. All the other models are flat so far, and so this provides an alternative to those who like a bit of a curve on this pretty large format monitor. It’s got a 32″ sized QD-OLED technology panel from Samsung Display’s 3rd generation, offering a 3840 x 2160 “4K” resolution and a 240Hz refresh rate combined. Being OLED it is well known for its amazing response times, black depth, contrast and HDR dimming capabilities.
The AW3225QF has a couple of interesting added features including support for Dolby Vision HDR content, alongside the normal HDR10 support. At the time of writing, this is the only one of these 32″ models that has this as a currently available feature, although Asus are planning to add support for it to their PG32UCDM later in the year. There is also support for eARC Dolby Atmos sound via the HDMI 2.1 connection which is unique at the moment in the monitor market.
Let’s see how this model performs in our testing.
| Where to Buy |
 __ __ — — |
| #affiliate.We may earn a commission if you purchase from our affiliate links in this content – TFTCentral is a participant in the Amazon Services LLC Associates Programme, an affiliate advertising programme designed to provide a means for sites to earn advertising fees by advertising and linking to Amazon.com, Amazon.co.uk, Amazon.de, Amazon.ca and other Amazon stores worldwide. We also participate in a similar scheme for Overclockers.co.uk, Newegg, Bestbuy and some manufacturers. |
Key Specs and Features
- 32″ size (exact 31.6″), 16:9 aspect ratio
- Curved with 1700R curvature
- 3840 x 2160 “4K” resolution
- Samsung Display QD-OLED technology panel (gen 3)
- 240Hz refresh rate
- Adaptive-sync for VRR, including NVIDIA ‘G-sync Compatible’ and VESA ‘AdaptiveSync 240’ certifications
- 0.03ms G2G rated response time
- 1000 nits peak brightness (HDR)
- VESA DisplayHDR 400 True Black certification
- HDR 10 and Dolby Vision HDR format support
- 1x DisplayPort 1.4 (with DSC) and 2x HDMI 2.1 video interfaces (including HDMI-VRR and eARC Dolby Atmos sound)
- 3x USB data ports (1 quick access), 1x USB-C data port (quick access)
- Adjustable stand with tilt, height and swivel adjustments (no rotate)
Note: the screen was tested using the latest M2B103 firmware available at the time of testing

Design and Features

The AW3225QF comes in a black and white design. There is a mid grey “Alienware” logo in the middle of the bottom bezel and a power LED on the bottom right hand edge. The stand has a white plastic finish as you can see in the provided images.

The back of the screen is encased in a white plastic housing for the central section where the stand attaches, and where all the internal electronics are housed. The screen has an internal power supply, so no need for any power bricks here. There is some fairly subtle RGB lighting features on the back which can be controlled or disabled via the OSD menu, with a small Alien logo and a “32” label on the back.

The monitor arm and foot are finished in the same white plastic but provide a strong and stable support for the large panel. There are tilt, height and swivel adjustments available from the stand which are all smooth and pretty easy to move. There is a little wobble from the stand as you move it around, or when using the OSD joystick controller which is located on the bottom edge of the screen in the middle.

The AW3225QF has an active cooling fan inside to keep the panel and components cool. We didn’t notice this in action above our normal system fans, but if you press your ear up against the screen you can hear it a little. Maybe a concern for those with super-quiet or silent systems but it seems to be very quiet here which is good news.

The screen has a reasonable range of modern connectivity options with DisplayPort 1.4 (with DSC) and 2x HDMI 2.1 ports available. Why not DisplayPort 2.1 you might ask? That’s discussed at length in our article here: When is DisplayPort 2.1 Going to be Used on Monitors?
Unlike the smaller 27″ AW2725DF, the HDMI ports are actually real HDMI 2.1 ports here with proper capabilities and the full 48Gbps bandwidth. We will look at console support later in the review.
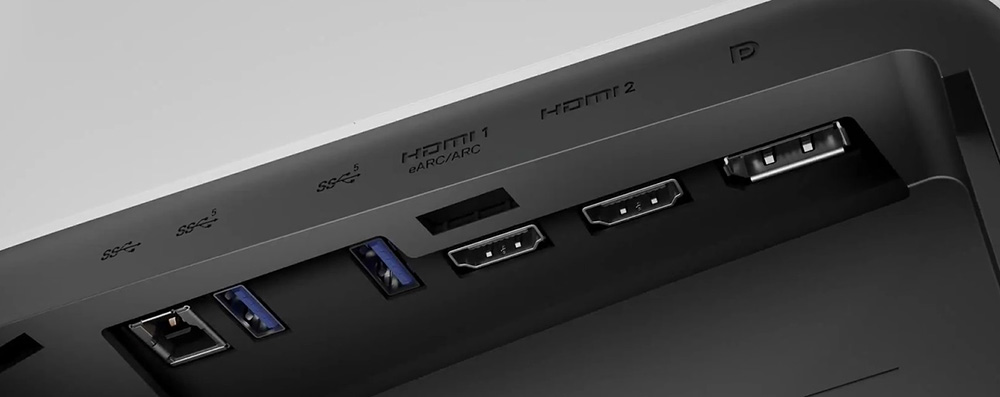
There are also 3x USB data ports (1 easy access on the bottom of the screen) and 1x USB-C (data and limited BC1.2 power-charging only) which is located on the bottom of the screen for easy access. The omission of USB type-C with DP Alt mode and a high power delivery is also a shame, and may be a disappointment to some people. PiP and PbP are supported here, but there’s no KVM function on this model.
It felt like Dell missed a trick here really as although it’s a new, high spec panel being used, they seem to have scrimped a bit on features and connections which is usually an area they focus on a lot. This is presumably to allow a competitive price point for this model, but other competing 32″ models have more features and connections so keep that in mind when you consider what you need.


The OSD is controlled through a single joystick toggle on the bottom of the screen. This provides quick, snappy and intuitive access around the menu and works well. There’s not a huge number of settings to play with in the menu, but it does the job well enough.
Brightness and Contrast

In SDR mode the screen operates with uniform brightness at all settings, and without any dimming caused by the ABL. There’s no setting to enable or disable this behaviour, it’s just how the screen has been configured to operate. There is a bit of an oddity with how bright the screen can reach though depending on the preset mode you use.
When originally testing the screen using the default ‘standard’ preset mode and at the full 100% brightness setting the screen reached ~271 nits luminance using the test patterns of different APL areas in the Calman software. In desktop use the measurements were for some reason around 30 – 40 nits lower though. It looks like the screen perhaps includes a logo detection feature (that cannot be turned off in the OSD menu), which is dimming real-world content a bit outside of the test patterns. We saw the same slight dimming on the Asus and MSI screens when we tested those with that feature enabled, so that’s a good bet as to why there’s a difference here. This happens in the ‘standard’ mode, as well as the ‘custom color’ mode you might want to use for calibration. It does not happen though in the ‘Creator’ modes like the sRGB emulation, which seems to disable the hidden logo detection, or at least avoids this dimming.
271 nits (or around 240 nits outside of the Creator modes) which should be adequate for most users. This isn’t as bright as LCD screens can reach, especially those with Mini LED backlights, so if you’re using the screen in a very bright room then this could be more limiting. OLED panels aren’t generally well suited to those very bright room conditions anyway, and 271 nits maximum is on par with other modern OLED monitors. The screen could reach down to ~32 nits minimum which gives you a good adjustment range for darker room conditions if you need.
We have provided some recommended brightness settings to achieve other popular luminance levels, and you can see that at all settings the screen retains a uniform brightness, regardless of the content on the screen and the APL. One odd exception was that we noticed that the brightness did fluctuate a bit if you have the OSD menu open, although that shouldn’t be of any relevance in normal use.
- Useful reading – OLED Dimming Confusion – APL, ABL, ASBL, TPC and GSR Explained
Black Depth, Shadow Detail and Contrast
Obviously one of the key benefits of this OLED panel is the fact it can generate true blacks and a basically infinite contrast ratio. Each pixel can be fully turned off individually, resulting in basically an infinite contrast ratio. There’s no need for backlight local dimming here like there is on LCD’s and the black depth and contrast ratio can surpass all LCD panel technologies including VA panels by a long way. In darker room conditions blacks look inky and deep, and you get excellent local contrast between different areas of an image with no blooming or halos.
Your ambient lighting may have some impact on perceived contrast ratio though due to the Quantum Dot coating and the lack of a polarizer. In brighter rooms, or where lights can shine on to the panel surface there is a fairly noticeable impact to contrast and black depth, more so than on competing WOLED panels which do use a polarizer. You get some raised blacks, where they can start to look more dark grey in appearance and the best viewing experience is in a darker room, although the same can be said really for any display panel. This phenomenon is explored and tested further in our article linked here:
- Related content: The OLED Black Depth Lie – When Panel Type and Coating Matters
The near black shadow detail was good in the default ‘standard’ mode (tested below), and it was possible to pick out dark grey shades in this test image with box 4 being the first that was easy to distinguish before calibration. This is something that can often be an issue on OLED panels, but it’s a bit better here than on many OLED panels. This was the same in the sRGB mode (again tested below) with box 4 being the first visible then.
In SDR there is an additional ‘Dark Stabilizer’ setting which has levels from 0 (off) to 3 available. Level 1 brightens the darkest grey shades a little without any noticeable impact to black levels and so may be useful. The higher settings of 2 and 3 brought our more dark shadow detail still, but this was at the cost of the blacks being raised. This may vary depending on the preset mode you use and your individual screen, but use the linked test image above and tweak accordingly if you need.

Like most OLED screens there is a minor fluctuation of the backlight, and in this case it operates in sync with the refresh rate, whatever you have that set at. Above it’s operating at 240Hz so there’s a small fluctuation every ~4.17ms. You can see on the graph above that the 0V would be an “off” state, so the amplitude of this fluctuation is minor, and does not produce any visible flickering or anything like that in practice. It’s not the same as PWM on an LCD monitor where the backlight is rapidly switched fully off and on when trying to dim the brightness level. Obviously being an OLED panel there is no backlight here anyway, and this minor fluctuation didn’t cause us any problems in real use and would be considered flicker free.
Testing Methodology Explained (SDR)

Performance is measured and evaluated with a high degree of accuracy using a range of testing devices and software. The results are carefully selected to provide the most useful and relevant information that can help evaluate the display while filtering out the wide range of information and figures that will be unnecessary. For measurement, we use a UPRtek MK550T spectroradiometer which is particularly accurate for colour gamut and colour spectrum measurements. We also use an X-rite i1 Pro 2 Spectrophotometer and a X-rite i1 Display Pro Plus colorimeter for various measurements. Several other software packages are incorporated including Portrait Displays’ Calman color calibration software – available from Portrait.com.
We measure the screen at default settings (with all ICC profiles deactivated and factory settings used), and any other modes that are of interest such as sRGB emulation presets. We then calibrate and profile the screen before re-measuring the calibrated state.
The results presented can be interpreted as follows:
- Gamma – we aim for 2.2 gamma which is the default for computer monitors in SDR mode. Testing of some modes might be based on a different gamma but we will state that in the commentary if applicable. A graph is provided tracking the 2.2 gamma across different grey shades and ideally the grey line representing the monitor measurements should be horizontal and flat at the 2.2 level, marked by the yellow line. Depending on where the gamma is too low or too high, it can have an impact on the image in certain ways. You can see our gamma explanation graph to help understand that more. Beneath the gamma graph we include the average overall gamma achieved along with the average for dark shades (0 black to 50 grey) and for lighter shades (50 grey to 100 white).
- RGB Balance and colour temperature – the RGB balance graph shows the relative balance between red, green and blue primaries at each grey shade, from 0 (black) to 100 (white). Ideally all 3 lines should be flat at the 100% level which would represent a balanced 6500K average colour temperature for all grey shades. This is the target colour temperature for desktop monitors, popular colour spaces like sRGB and ‘Display DCI-P3’ and is also the temperature of daylight. It is the most common colour temperature for displays, also sometimes referred to as D65. Where the RGB lines deviate from this 100% flat level the image may become too warm or cool, or show a tint towards a certain colour visually. Beneath this RGB balance graph we provide the average correlated colour temperature for all grey shades measured, along with its percentage deviance from the 6500K target. We also provide the white point colour temperature and its deviance from 6500K, as this is particularly important when viewing lots of white background and office content.
- Greyscale dE – this graph tracks the accuracy of each greyscale shade measured from 0 (black) to 100 (white). The accuracy of each grey shade will be impacted by the colour temperature and gamma of the display. The lower the dE the better, with differences of <1 being imperceptible (marked by the green line on the graph), and differences between 1 and 3 being small (below the yellow line). Anything over dE 3 needs correcting and causes more obvious differences in appearance relative to what should be shown. In the table beneath the graph we provide the average dE across all grey shades, as well as the white point dE (important when considering using the screen for lots of white background and office content), and the max greyscale dE as well.
- Luminance, black depth and contrast ratio (static) – measuring the brightness, black depth and resulting contrast ratio of the mode being tested, whether that is at default settings or later after calibration and profiling. We aim for 120 cd/m2 luminance which is the recommended luminance for LCD/OLED desktop monitors in normal lighting conditions. Black depth should be as low as possible, and contrast ratio should be as high as possible.
- Shadow detail – this is evaluated with the screen configured to a 200 nits white luminance for consistency between different monitors, and viewed in a dimly lit room. This first 16 greyscale shades are measured using our UPRTek MK550T spectro device (0.002 nits lower limit) for shades near-black, and the results are plotted on a graph relative to a target gamma curve (usually 2.2 gamma). Where the measurement line crosses the 0.01 nits point on the Y-axis is typically the visual threshold for where we would start to be able to detect luminance compared with black (0.00 nits). We combine these objective measurements with visual tests using a grey shade test pattern to determine the first visible shade, and then rank the shadow detail performance accordingly.
- Gamut coverage – we provide measurements of the screens colour gamut relative to various reference spaces including sRGB, DCI-P3, Adobe RGB and Rec.2020. Coverage is shown in absolute numbers as well as relative, which helps identify where the coverage extends beyond a given reference space. A CIE-1976 chromaticity diagram (which provides improved accuracy compared with older CIE-1931 methods) is included which provides a visual representation of the monitors colour gamut coverage triangle as compared with sRGB, and if appropriate also relative to a wide gamut reference space such as DCI-P3. The reference triangle will be marked on the CIE diagram as well.
- dE colour accuracy – a wide range of colours are tested and the colour accuracy dE measured. We compare these produced colours to the sRGB reference space, and if applicable when measuring a wide gamut screen we also provide the accuracy relative to a specific wide gamut reference such as DCI-P3. An average dE and maximum dE is provided along with an overall screen rating. The lower the dE the better, with differences of <1 being imperceptible (marked by the green area on the graph), and differences between 1 and 3 being small (yellow areas). Anything over dE 3 needs correcting and causes more obvious differences in appearance relative to what should be shown. dE 2000 is used for improved accuracy and providing a better representation of what you would see as a user, compared with older dE methods like dE 1994, as it takes into account the human eye’s perceptual sensitivity to different colours.
Default Setup

The screen comes out of the box in it’s ‘standard’ preset mode and operating in the panels full native colour space. Within the OSD menu there aren’t really any settings you can change for the picture, other than brightness and contrast when using this mode. The default gamma was good overall, with a 2.16 average measured. It dipped too low in the brighter greys which can result in a bit of lost detail in those shades. The greyscale RGB balance was reasonable, with the red channel being a bit too high, and the blue being a bit too low. This resulted in a 5% deviance for colour temp, being a bit too warm at 6169K average across the greyscale, and 5% too warm for white point at 6192K. The overall greyscale accuracy was decent though with dE 1.7 average measured. A pretty good overall setup really and very similar to what we’d experienced on the smaller 27″ AW2725DF recently.

The top left hand CIE diagram shows that the colour space of the monitor extends a long away beyond the sRGB colour space reference because of the Quantum Dot coating of the panel. In fact we measured a 136.6% relative coverage, with large over-coverage in greens and especially red shades. The accuracy of sRGB colours (used for SDR content) was poor as you would expect from a very wide gamut screen like this, because of that over-saturation. The colours did look bright and vivid though, but not accurate if you want to work with sRGB content.
The bottom section shows that the colour space more closely matches the DCI-P3 reference, commonly used for HDR content, although it still extends a fair way beyond that reference too. The accuracy of DCI-P3 colours was better though and rated as “good”, with a dE average of 2.1 measured. There is also wide coverage of the Adobe RGB colour space (97.8%) commonly used for professional and photography work, if you wanted to work within a color-managed workflow in that gamut. You would need to be able to profile the screen yourself though to map the gamut back to Adobe RGB properly, as there is large over-coverage of that space by default too (117%). We had a 79.2% coverage of the large Rec.2020 colour space as well here, which was typical for a QD-OLED panel, slightly lower than the 27″ QD-OLED panels which we believe is probably related to the pico inkjet production process which allows for this higher pixel density on the 32″ panel.
Factory Calibration


The screen is provided with a factory calibration report in the box, confirming that it has been calibrated in the sRGB and DCI-P3 modes. These are available via the ‘Creator’ preset mode, which is actually the only one where you can choose these colour space emulations.
- The sRGB mode has apparently been calibrated to an sRGB (close to 2.2) gamma, 6500K greyscale and dE < 2
- The DCI-P3 mode has been calibrated to a 2.6 gamma (the target for that reference), 6500K colour temp and < 2 also
We will test both modes below.
sRGB Emulation Mode
We noticed a bug with the monitor settings in this mode in that the gamma seems to default to the lowest 1.8 setting in the OSD menu, and you need to change this yourself to 2.2 if you want to deliver the correct gamma. This will hopefully be fixed in a future update, with the screen supporting user-updateable firmware.

The sRGB mode showed a very good overall setup. There was an average 2.21 gamma measured although you can see it’s slightly too low in the darker grey shades leaving them a little brighter than intended. Colour temp and white point were better than they had been in the default ‘standard’ mode with a good balance of the red, green and blue channels shown on the middle graph. It remained slightly too warm still at 6372K white point (2% out from our target) but not by anything that should really be noticeable in practice. The greyscale accuracy was reasonably good too, with an average dE 2.1 measured.

The best thing about this ‘sRGB’ gamut Creator mode was that it had a very good clamping of the native colour space back to sRGB as you can see from the left hand CIE diagram. We had a 99.4% absolute coverage, and only minor over-coverage at 104.7% relative coverage measured. In this preset mode you still had access to the brightness and contrast controls which was good news, so you can adjust the brightness to your liking. Gamma setting was also accessible (and as we said, you need to change this to 2.2), but there was no control over colour temp or RGB channels. Thankfully as we showed above, the colour temp and white point were very good anyway. In this sRGB mode we had good colour accuracy now for sRGB colours, with a dE average of only 1.7. This was a good and very useable sRGB mode on the AW3225QF.
DCI-P3 Emulation mode

The same cannot be said for the DCI-P3 emulation mode which was all over the place and really poorly configured relative to the provided factory report. The same bug as before existed where you need to manually change the gamma setting in the OSD menu for this mode, as it defaults to 2.2 but according to the calibration report, should be 2.6. That is a common target used for DCI-P3 content. This gamma setting is actually not remembered between the two Creator modes so if you wanted to use one mode for sRGB and a different mode for DCI-P3 then you have to manually change it.
Gamma tracking was a bit high as you can see, being too high in darker grey shades and overall measuring a 2.70 gamma average. The other main problem seemed to be with the colour temp, being too warm by 6% compared with the listed 6500K target on the calibration report for white point, and having a noticeable green tint to grey shades because of the poor RGB balance. This resulted in a bad greyscale accuracy as well, with a dE 8.7 average measured.
You will note that in this mode the brightness control is turned down to 15% by default although you still have access to change this. It results in a much darker image and a 50 nits luminance measured. This is because 48 nits is the target for white luminance in the DCI-P3 Display standard, although this target was not listed on the calibration report.

You can see that the clamping of the colour space back to DCI-P3 is very good here, cutting down on the over-coverage the default mode had shown. The colour accuracy was bad though with 5.6 dE average recorded, caused primarily by the inaccuracies with the colour temp and the greenish tint to grey shades.
At first we assumed there was something wrong or broken with the DCI-P3 mode, but actually what we believe has happened here is that the display has been factory calibrated to slightly different targets, and it might be the provided paper report that is wrong. Given that the screen was targeted to the low 48 nits luminance for DCI-P3, we wonder if actually maybe they have calibrated the screen to the 6300K colour temp associated with “DCI-P3 Theater” instead of the 6500K of “DCI-P3 Display”? The report suggests it should be 6500K, but the measured performance seems closer to 6300K.
We re-measured the display based on this assumption, and this improved the results as now it’s performing closer to its “intended” targets:
Assuming 6300K colour temp target instead


So this mode is now more “accurate” if indeed you wanted to target the specifications of the DCI-P3 Theater standard. We’re not sure which Dell were really targeting here, but for now we have to take the paper report on face value and would therefore say that the DCI-P3 mode is poorly configured and not very accurate at all. This was the same situation as on their 27″ AW2725DF we reviewed recently too. They need to update this in a future firmware fix.
Calibration


Calibration and profiling can produce good results if you have a suitable calibration device and software. We used the ‘Custom Color’ mode for this where you have access to the RGB levels. This was profiled to 2.2 gamma, 6500K colour temp and to the sRGB colour space. The screen was left in its native wide gamut mode, but this profile will be used in colour-aware applications (e.g. Photoshop) to map back to sRGB in this instance. Overall the calibrated results were very good as you’d hope. You can find our calibrated settings and ICC profile in our ICC profile database now.
We should note here that the AW3225QF does not feature hardware calibration, so you are reliant on ICC profiles and colour aware applications, as opposed to being able to hardware calibrate the screen itself.
Best Settings Guide
General and Office Use

Resolution and Scaling
The fairly large screen size of 31.5″ provides a decent size upgrade from common 27″ screens, and this combined with the 3840 x 2160 “4K” resolution gives you a higher pixel density at 140 PPI. This 4K resolution is probably still a bit too high to use at native scaling (100%) for some people on a screen even of this pretty large size, although some people may find it ok. Text is small but if you’ve got good eye-sight and are up close then it’s still reasonable and does provide you then with a massive screen real estate and very sharp picture.
Other people will probably want to use operating system scaling to ensure fonts and text are a more sensible and readable size though. 150% is unnecessarily large despite being the “recommended” option detected by Windows, with 125% scaling offering a nice balance on a screen of this size we think. That gives you comfortable text size which is very similar to a 27″ 1440p screen, but does give you the equivalent desktop real-estate area of a 3072 x 1728 resolution. So that’s quite a nice jump up from common 2560 x 1440 resolution screens in this approximate size range. The extra pixel density of the 4K resolution will provide a very sharp and clear image for all uses including office and general applications. Just make sure that your software will support scaling effectively as it can sometimes be a bit difficult to get it right.
Keep in mind that not all Operating Systems and applications handle scaling the same. More recent versions of Windows tend to handle it all better, and recent versions of Mac OS are pretty solid as well. Some applications and games don’t handle scaling correctly and so you can end up with some things with very minute text and fonts and some things which don’t scale completely in every place. Keep this in mind if you’re selecting any super high resolution display as it could be an important factor. You need to ensure you have the necessary operating system and applications to handle scaling effectively for your needs. It does make life a bit more complicated than if you just ran at a native resolution and 100% scaling. If you have the necessary software and operating system then the 4K resolution provides a very sharp and crisp image though.
Sub-pixel Layout and Text Rendering

Because of the somewhat unusual triangular shaped RGB sub-pixel layout, slight text fringing has been a challenge on older QD-OLED monitors. This had been improved with the Second Generation QD-OLED panels including two we’ve reviewed last year from Samsung and Asus, and that improvement has carried through to these new third generation panels like that being used here on the AW3225QF.
These second/third gen panels have a slightly improved subpixel size and shape with more pixel fill, although still in the triangular RGB layout, but improving text rendering a bit as a result. We had been pleased with the results when we’d tested the earlier second gen panels with a 49″ screen size and 5120 x 1440 resolution.
Here, this updated pixel shape is also combined with the increased pixel density enabled by the 4K resolution and 140 PPI pixel density. The result is very good, and text clarity and sharpness is improved even further over the older ~110 PPI panels. It was very hard to detect issues at all with text clarity and fringing from any normal viewing position, and we tested the screen at 100%, 125% and 150% scaling levels. The combination of the updated layout and the higher pixel density and resolution seems to have almost entirely eliminated the issue and we expect this to be perfectly fine for the vast majority of people even for office and text work.
Curve

This is the only 32″ OLED monitor announced so far that uses the curved version of the Samsung QD-OLED panel. It’s a fairly subtle curve at only 1700R and in practice it didn’t feel too aggressive. We found it a bit more comfortable for general use, gaming and multimedia as it helps brings the edges of the large screen a little nearer to you, and improves the feeling or immersion a bit. For office applications it’s not quite as well-suited though, as straight lines in spreadsheets and design applications can look skewed and distorted. For casual desktop and internet use alongside gaming and video, it shouldn’t present any real problem though and we certainly preferred the subtle curve here to the more aggressive curves you see on the market in some cases, like 1000R or even 800R. No real complaints about the curvature on this screen to be honest, but it will be down to user preference.
OLED Care

Dell don’t provide many options on the screen for OLED care oddly. There’s a pixel refresh and a panel refresh function which are used to “clean” and optimise the panel periodically. The user manual confirms the following:
- Pixel Refresh – To reduce temporary image retention on the screen, you can manually activate this function after using the monitor for a couple of hours. Alternatively, the function is activated automatically when you have used the monitor for 4 hours. The process takes approximately 6 to 8 minutes to complete.
- Panel Refresh – To prevent permanent image retention caused by static content when you use the monitor for 9000 hours, you can manually activate this function to refresh the pixels. Alternatively, the function is activated automatically when the accumulated usage time exceeds the factory default setting (9000 hours). The process takes approximately an hour to complete.
There’s no settings for screen/pixel shift, or logo dimming or anything like that offered here so we’d consider the OLED care features to be quite limited to be honest. We believe there is an occasional pixel shift in operation during use although its very subtle and we didn’t really notice it at all during use if it is active, and usually we are quite sensitive to this feature on desktop applications.
Dell do offer a standard 3-year warranty which includes burn-in protection so that should give you peace of mind hopefully. We would have liked to have seen a few more protection options included here though really.
Screen coating
The screen coating of the QD-OLED panel is what we’ve always called “semi glossy”. It’s the same coating as seen on all the other QD-OLED monitors to date. It looks cleaner and clearer than competing WOLED panels which have a fairly grainy matte anti-glare coating and a lot of people, us included, prefer the overall image clarity of this finish. It’s not a full glossy coating, as some anti-reflective (AR) treatment is also applied, and In certain situations and lighting conditions you will see more reflections than a matte coated screen and light isn’t diffused in the same way. During typical day to day usage, even with a window facing the screen we didn’t find it too bad at all. The coating can make colours and blacks pop a bit more, in the right lighting conditions. We quite like the coating balance here personally from QD-OLED panels.
One issue with QD-OLED that is often incorrectly attributed to the panel coating is the reduction in black depth and perceived contrast when viewing the screen in brighter room conditions. This is actually caused by the quantum dot layer, and the fact that the panel does not have a normal polarizer, and this causes some of the ambient light to reflect back at you, leading to a drop in perceived contrast and black depth. That’s still an issue here although blacks still look very good and should still look superior to LCD technologies in most situations. For optimal viewing, and this goes for any OLED really, you want to be using the screen in a darker room, with lower ambient lighting. For day to day general and office work, which is what we’re talking about in this section, it’s not really an issue.
- Related content: The OLED Black Depth Lie – When Panel Type and Coating Matters
Spectral Distribution and Blue Light

The native panel spectral distribution is shown above at a calibrated 6500K white point, where the blue peak is at 453 nm and has a 27.37% blue light ratio. The screen is certified under the TUV Rheinland scheme as a “low blue light hardware solution”. It has however not been certified as part of the Eyesafe certified range of products where there is a supposed harmful range between 415 – 455nm. There are no blue light modes or options provided on the screen at all.
Useful Features
There’s limited additional features on this monitor for office and general uses. It’s handy to see a few USB ports and a USB-C data port, but we would have liked to have seen proper USB type-C connectivity with DP Alt mode for video, and a decent power delivery to handle single cable connections from compatible devices like laptops. That’s featured widely in the monitor market now, and it’s a shame it’s left off here. Having 1x USB A and 1x USB-C port on the bottom edge of the screen was a nice touch though for easy access.

There’s no KVM support, ambient light sensor, human motion sensor, audio output or integrated speakers available on this model, all of which are quite common again in the market today and could have been useful for these uses. PiP and PbP are supported if you want to handle multiple video inputs on the screen though. Other new 32″ 4K OLED screens do have some of these features and so Dell’s offering falls behind a bit in those areas. You will of course need to consider if any of these are useful to you.
eARC support
The screen does have eARC support from one of the HBMI connections, meaning you can easily pass through sound (including Dolby Atmos support) to a soundbar or external speaker system if you want. This could be useful when connecting external devices and games consoles to the screen and it’s a feature currently unique to the AW3225QF in the monitor market. We’d like to see that more widely adopted by other manufacturers as a useful extra HDMI feature.
Gaming

The AW3225QF is heavily focused on its gaming capabilities. The screen uses a QD-OLED panel which is well-known for its near-instant response times. As a result it does not need to use overdrive technology in the same way as a desktop LCD panel would, and there aren’t any controls for the response time or overdrive in the OSD menu as they’re not needed. Dell, like other OLED display manufacturers quote a very low 0.03ms G2G response time in their spec, and while true <1ms G2G should be expected from this technology this is a little unrealistic.
4K @ 240Hz for the first time in the OLED market
| (at native resolution) | Refresh Rate |
| Maximum Refresh Rate DisplayPort | 240Hz |
| Maximum Refresh Rate HDMI | 240Hz |
| VRR range | 48 – 240Hz |
This year is the first time that 4K @ 240Hz has been available in the OLED segment and it’s a very attractive combination for many people. You will of course need a very powerful system and graphics card to get anywhere near 4K @ 240Hz, although you may of course want to play older games or at lower settings where this can be more achievable. There’s also plenty of future-proof room there as other system components are improved and updated over the coming years and new graphics card capabilities are developed. The 4K resolution provides a super sharp and crisp image, with more detail and clarity than lower resolution panels. It also makes the screen well-equipped to handle modern 4K gaming from PC’s and consoles.
| VRR capabilities and Certification | |
| AMD FreeSync certification | |
| Native NVIDIA G-sync module | |
| NVIDIA ‘G-sync Compatible’ certified | G-sync Compatible |
| VESA ‘AdaptiveSync’ certification | AdaptiveSync Display 240 |
| HDMI-VRR (consoles via HDMI 2.1) |
The screen has a native 240Hz refresh rate which is on par with a wide range of other OLED monitors on the market, including the other 32″ OLED monitors we’ve reviewed so far from Asus and MSI. This provides excellent motion clarity (demonstrated later), and can support high frame rates too, reducing overall system latency compared with lower refresh rate screens. Combined with a 4K (3840 x 2160) resolution, it’s a dream spec for many people.
To help support 3840 x 2160 @ 240Hz the screen features adaptive-sync, giving Variable Refresh Rate (VRR) support for both NVIDIA and AMD systems which is great news. The screen has also been certified under NVIDIA’s ‘G-sync Compatible’ scheme. and VESA’s ‘AdaptiveSync 240’ tier as well. This should give some added reassurance around VRR performance.
DSR / DLDSR
We tested support for NVIDIA DSR / DLDSR which can sometimes work on monitors with DSC (Display Stream Compression), but not always. We found that these technologies were not available over DisplayPort on this screen, even if you drop down to a lower refresh rate like 60Hz.
This is actually a lot less relevant on this screen anyway as it is already natively 4K, and has a high pixel density. DSR / DLDSR is more commonly aimed at use on lower resolution monitors with 1080p or 1440p resolution, where you can upscale the input image to 4K to improve sharpness and image clarity. In theory you could use it here to push beyond 4K but with the panel already offering a high resolution and density natively, its a lot less relevant. There is no benefit by the way in running the screen at a lower resolution and using DSR to upscale to 4K, you might as well just run at 4K natively which should be equally / less demanding on your system anyway. So in summary, the lack of DSR / DLDSR support is not a big issue on a native 4K screen of this size anyway.
QD-OLED panel benefits for gaming
The OLED panel provides super-deep blacks and a basically infinite contrast ratio which is of course excellent for gaming too. The per-pixel level dimming and high contrast ratio also make it well suited to HDR gaming, and we will measure HDR performance a bit later. This screen already features both HDR10 and Dolby Vision HDR support, with the latter being a pretty new feature in the monitor market and potentially useful for some gaming situations where DV is supported.
The very wide viewing angles of this technology are also excellent and make the screen suitable for viewing from many different positions if you need. These wide viewing angles importantly include the freedom from things like the pale/white “IPS glow” that you get on darker content on that common LCD technology. There’s none of that here on the OLED panel.
Gaming extras and settings

Dell provide a few useful extras in the OSD menu including a ‘dark stabilizer’ setting (which works pretty nicely), frame rate counter, timer and display alignment control.
We should make a point here that the AW3225QF does not feature any blur reduction or BFI (Black Frame Insertion) mode unfortunately. That is available on the competing Asus ROG Swift PG32UCDM and can operate at 120Hz maximum on that screen, with some other limitations in its operation too. That could be potentially useful to some users to boost motion clarity when you can’t drive the 4K 240Hz refresh rate fully, or want to game at a lower refresh rate from an external device perhaps like a games console. Given its rather limited current operation on the Asus screen, we don’t miss it too much here, but some people may have found that useful had it been included.
Our thanks to the following manufacturers for support in the build of our new test system:
| AMD Ryzen 9 7950X | Buy AMD Ryzen 9 CPUs here on Amazon | |
| Asus ProArt B650-Creator | Buy Asus B650 motherboards here on Amazon | |
| Corsair DDR5 RAM | Buy here on Amazon | |
| Corsair H100i Elite Capellix AIO cooler | Buy Corsair coolers here on Amazon | |
| Corsair iCUE RGB Elite Fans | Buy here on Amazon | |
| NVIDIA RTX 3090 | Buy NVIDIA RTX graphics cards here on Amazon |
| We may earn a commission if you purchase from our affiliate links in this content – TFTCentral is a participant in the Amazon Services LLC Associates Programme, an affiliate advertising programme designed to provide a means for sites to earn advertising fees by advertising and linking to Amazon.com, Amazon.co.uk, Amazon.de, Amazon.ca and other Amazon stores worldwide. We also participate in a similar scheme for Overclockers.co.uk, Newegg, Bestbuy and some manufacturers. |
Response Times
As discussed in our detailed article about Response Time Testing – Pitfalls, Improvements and Updating Our Methodology we are using an improved and more accurate method for capturing G2G response times and overshoot, based on figures that are more reflective to what you see visually on the screen in real-World usage. Our article linked above talks through why this is better and how we arrived at this improved method in much more detail.

The above G2G response times are consistent at all refresh rates, including 240Hz, 120Hz and 60Hz and during VRR situations with changing frame rates. Thanks to the QD-OLED panel the response times are super-fast and near-instant, with an average of only 0.51ms G2G measured. The best case was an incredibly impressive 0.31ms and the overall response times were as expected from an OLED panel.
All transitions can keep up easily with the frame rate demands of 240Hz, and in fact this screen could comfortably keep up with >1000Hz if the panel could support it! Let’s hope OLED refresh rates are driven much higher in the coming years, as it’s a really well suited technology for that. We already know there are plans to produce panels up to 480Hz so higher refresh rates are definitely coming! There is also no visible overshoot evident which is great news too, so overall there was nice and clean pixel transition times.
Motion Clarity – Pursuit Camera Photos
We captured some pursuit camera photos of the screen at a variety of refresh rates, designed to capture real-world perceived motion clarity. This gives you a good indication of how the screen looks in real use, beyond raw measurements.

Despite the amazing pixel response times you still get large amount of blur at 60Hz due to the sample-and-hold nature of the OLED screen, you can’t expect miracles just because it’s got fast response times. There are major and obvious benefits in motion clarity as you increase to 120Hz high refresh rate mode, and this brings it on par with 120Hz OLED screens such as the popular 42″ sized displays like the LG 42C2 and LG 42C3 TV’s, and the Asus ROG Swift PG42UQ.
Like with other 240Hz OLED screens we’ve tested, moving up to 240Hz offers another significant and noticeable improvement in motion clarity, and the moving image is now sharper and cleaner. Tracking of moving content is now much easier and clearer. This really was excellent motion clarity and very impressive. If you can push the screen up to 240fps in your games, which will be a challenge of course in many situations at 4K, you will benefit from excellent clarity and smoothness as well as improved system latency due to the higher frame rate supported. There is no overshoot or any associated artefacts or trails at any refresh rate like you might get on LCD screens which was excellent. The motion clarity will be the same as the other 240Hz OLED monitors in the market, unsurprisingly given they are all using 240Hz OLED panels. This motion clarity is basically equivalent to a good 360Hz LCD panel so is very impressive.
We’ve only tested one faster OLED panel to date, that being the 360Hz Dell Alienware AW2725DF which offers some additional motion clarity, frame rate and system latency benefits. You can find information and comparisons for 360Hz OLED in our review.
Lag
Read our detailed article about input lag and the various measurement techniques which are used to evaluate this aspect of a display. The screens tested are split into two measurements which are based on our overall display lag tests and half the average G2G response time, as measured by our oscilloscope. The response time element, part of the lag you can see, is split from the overall display lag and shown on the graph as the green bar. From there, the signal processing (red bar) can be provided as a good estimation of the lag you would feel from the display. We also classify each display as follows:
Lag Classification (updated)
- Class 1) Less than 4.17ms – the equivalent to 1 frame lag of a display at 240Hz refresh rate – should be fine for gamers, even at high levels
- Class 2) A lag of 4.17 – 8.33ms – the equivalent of one to two frames at a 240Hz refresh rate – moderate lag but should be fine for many gamers. Caution advised for serious gaming
- Class 3) A lag of more than 8.33ms – the equivalent of more than 2 frames at a refresh rate of 240Hz, or 1 frame at 120Hz – Some noticeable lag in daily usage, not suitable for high end gaming


There is an extremely low lag on the AW3225QF measured at 0.43ms total display lag, and leaving us with only 0.30ms of estimated signal processing lag. This is perfectly fine for competitive gaming. This is higher at 60Hz refresh rate, measured at 8.2ms total display lag although not too bad.
Console Gaming
The screen features offers a 4K resolution and support for high refresh rates including 4K @ 120Hz, making it very well suited to modern games consoles like the Xbox Series X and PlayStation 5. Dell have included two full-bandwidth HDMI 2.1 ports, delivering 48 Gbps speed and therefore supporting the max bandwidth capabilities of the two consoles. The support for 4K resolution (natively here) means you can make use of HDR from the Xbox where that mode is only available at 4K, which is of course one of the key capabilities of this screen. The QD-OLED panel with its amazing contrast and blacks comes in to its own here for HDR gaming, providing an excellent image quality and HDR experience. More on HDR in a moment.
| Console Gaming | |
| Native panel resolution | 3840 x 2160 “4K” |
| Maximum resolution and refresh rate supported | 4K @ 120Hz |
| 4K at 24Hz support | |
| 4K at 50Hz support | |
| HDMI connection version | 2.1 |
| HDMI connection bandwidth | 48 Gbps |
| HDMI-CEC auto switch | |
| HDMI-VRR (over HDMI 2.1) | |
| HDR10 support | |
| Dolby Vision HDR support | |
| Ultra high speed HDMI 2.1 cable provided |
We confirmed via an Xbox Series X that 4K 120Hz (and at 10-bit, 4:4:4 chroma) works fine which means you have access to HDR gaming from that console, which is great news. There is support for 4K 50Hz and 24Hz, along with VRR. There’s even HDMI-CEC support available in the menu which will auto switch to the HDMI input when you power on an external device, and is a feature we’re starting to see included more on modern screens. That’s useful.
This screen can support HDR10 and Dolby Vision content, so if you want to game with DV from your console then that’s also available here. All in all, a full suite of console capabilities here.
Further recommended reading
HDR Testing Methodology Explained
Performance is measured and evaluated with a high degree of accuracy using a range of testing devices and software. The results are carefully selected to provide the most useful and relevant information that can help evaluate the display while filtering out the wide range of information and figures that will be unnecessary. For measurement, we use a UPRtek MK550T spectroradiometer which is particularly accurate for colour gamut and colour spectrum measurements. We also use an X-rite i1 Pro 2 Spectrophotometer and a X-rite i1 Display Pro Plus colorimeter for various measurements. Several other software packages are incorporated including Portrait Displays’ Calman color calibration software – available from Portrait.com.
We measure the screen at default settings (with all ICC profiles deactivated and factory settings used). The results presented can be interpreted as follows:
HDR accuracy section
- Greyscale dE – this graph tracks the accuracy of each greyscale shade measured from 0 (black) to 100 (white). The accuracy of each grey shade will be impacted by the colour temperature and gamma of the display. The lower the dE the better, with differences of <1 being imperceptible (marked by the green line on the graph), and differences between 1 and 3 being small (below the yellow line). Anything over dE 3 needs correcting and causes more obvious differences in appearance relative to what should be shown. In the table beneath the graph we provide the average dE across all grey shades, as well as the white point dE (important when considering using the screen for lots of white background and office content), and the max greyscale dE as well.
- RGB Balance and colour temperature – the RGB balance graph shows the relative balance between red, green and blue primaries at each grey shade, from 0 (black) to 100 (white). Ideally all 3 lines should be flat at the 100% level which would represent a balanced 6500k average colour temperature for all grey shades. This is the target colour temperature for desktop monitors, popular colour spaces like sRGB and ‘Display DCI-P3’ and is also the temperature of daylight. It is the most common colour temperature for displays, also sometimes referred to as D65. Where the RGB lines deviate from this 100% flat level the image may become too warm or cool. Beneath this RGB balance graph we provide the average correlated colour temperature for all grey shades measured, along with its percentage deviance from the 6500k target. We also provide the white point colour temperature and its deviance from 6500k, as this is particularly important when viewing lots of white background and office content.
- ST 2084 EOTF (PQ) tracking – this graph tracks the PQ curve in HDR mode, akin to gamma measurements in SDR. The yellow line represents the ideal PQ curve, while the grey line plots the monitors measured performance.
- Luminance, black depth and contrast ratio (top right hand table) – measuring the brightness, black depth and resulting contrast ratio of the mode being tested. The luminance figure captured here is from a standard 10% APL window area measurement, although further luminance measurements are included in a separate section to capture “peak brightness” and the luminance at other APL areas. This section also measures the black depth on the screen and the resulting contrast ratio.
For HDR, any local dimming is left enabled, and so we measure the black depth adjacent to a white test image and calculate the “local contrast ratio” from there. We also measure the black depth towards the edges of the screen, away from the white test area in order to calculate the “maximum full frame contrast ratio” across the whole panel. These figures will often be different on LCD screens with local dimming, as this dimming can be more effective for dark areas further away from light areas.
HDR Brightness section
- The peak luminance of a white test pattern is measured at different APL (Average Picture Level) areas, ranging from a small 1% window which represents small image highlights, right up to a 100% APL which is a full white screen. This tells you how high the luminance of white is on the screen, with this typically getting lower as the APL increases in size. Comparisons are also provided against other screens where relevant..
HDR colours section
- Gamut coverage (2D) – we provide measurements of the screens colour gamut for HDR relative to the very wide Rec.2020 colour space. Coverage is shown in absolute numbers as well as relative, which helps identify where the coverage extends beyond a given reference space. A CIE-1976 chromaticity diagram (which provides improved accuracy compared with older CIE-1931 methods) is included which provides a visual representation of the monitors 2D colour gamut coverage triangle as compared with Rec.2020. The higher the coverage, the better.
- dE colour accuracy – a wide range of Rec.2020 colours are tested and the colour accuracy dE measured. An average dE and maximum dE is provided along with an overall screen rating. These numbers are calculated based on the colour tone and hue, and ignore any luminance error. The lower the dE the better, with differences of <1 being imperceptible (marked by the green area on the graph), and differences between 1 and 3 being small (yellow areas). Anything over dE 3 needs correcting and causes more obvious differences in appearance relative to what should be shown. dE 2000 is used for improved accuracy and providing a better representation of what you would see as a user, compared with older dE methods like dE 1994, as it takes into account the human eye’s perceptual sensitivity to different colours.
HDR

Featuring a QD-OLED panel, the AW3225QF is well equipped to handle HDR content with its per-pixel level dimming allowing for true blacks, a basically infinite contrast ratio and the avoidance of all blooming and halos. In these regards it can easily surpass any Mini LED backlit LCD monitor. However, it cannot reach the same luminance levels as Mini LED screens, and this screen carries a “peak brightness” spec of 1000 nits, which will then also lower as the content on your screen changes and the APL increases which is normal on this technology. This is one key area where Mini LED screens can look brighter and deliver a more impressive HDR experience.
Being a QD-OLED panel it does also suffer from a reduced perceived black depth and contrast due to the lack of a polarizer and the Quantum Dot layer, which is evident in brighter lit rooms. For HDR content viewing you’d ideally want to be using the screen in a darker room if you can, to maximise the HDR impact and reduce this issue.
| HDR Technical Capabilities | ||
| VESA DisplayHDR certification level | ‘DisplayHDR 400 True Black’ | |
| Multiple HDR formats supported | HDR10 and Dolby Vision content | |
| Local dimming | Per pixel level dimming | |
| High number of local dimming zones | ~8.3 million (per pixel) | |
| Increased peak brightness | 1055 nits measured peak | |
| Reaching advertised peak brightness | Reaching advertised 1000 nits | |
| Increased dynamic range (contrast) max | ~Infinite | |
| Increased “local” HDR contrast ratio max | ~Infinite | |
| Wide colour gamut >90% DCI-P3 | 99% absolute 108.9% relative | |
| 10-bit colour depth support | 10-bit supported | |
Dolby Vision HDR
The AW3225QF is the first PC monitor we’ve tested to have Dolby Vision HDR support which gives you further capabilities from compatible devices and inputs. This includes popular streaming apps like Netflix for example, and modern games consoles like the Xbox Series X. Early users and reviewers of this screen complained about a Dolby Vision “bug” which was causing the monitor to operate in DV mode, even when the content being sent was actually supposed to be in the common HDR10 format. This led to some inaccurate behaviour and tone mapping of the content.
This doesn’t appear to be a bug simply with the monitor itself, it appears to be the combination of this monitor (perhaps all of the new DV capable monitors?) and its interaction with a PC and Windows. This seems to happen over both DisplayPort and HDMI connections and could also be related to the scaler and the way DV is being implemented in these early days on desktop PC monitors. It’s hard to pin down what is causing the issue at the moment, but what we do know is that at the moment, if you enable any HDR input signal from the PC including just regular HDR10 content, the screen shifts in to its Dolby Vision mode which you don’t want. This does not seem to happen when using an external device, like for instance the Xbox Series X that we tested with it. The screen would correctly switch between HDR10 and DV modes depending on the content being sent, so it seems to be an issue isolated to PC input at the moment.
This might be because there’s very little true DV content on PC at the moment and not even any license agreement in place between Microsoft and Dolby. It seems Windows does not correctly output the content being sent to the screen in this instance. It seems to see a DV-capable monitor connected, and just sends any HDR content in that mode – leading to problems if the content wasn’t really DV. This doesn’t happen though when using a PC with a DV-capable TV, for instance we’ve tested this plenty of times on LG’s C series of OLED TV’s.
As you can see, it’s hard to blame the monitor on its own – since that behaves properly with external devices. And it’s hard to blame Windows on its own – since that behaves properly when connected to DV-capable TV’s. More investigation is needed on what is causing this, especially as more DV-capable monitors are now being released.

Anyway, to help get around this problem a new M2B103 firmware update was released in late Feb 2024. Dell now provide a toggle in the OSD menu to enable/disable Dolby Vision as shown above. This allows you to disable DV support on the monitor if you want and revert to standard HDR10 mode. For PC content and gaming, this is likely to be the most common configuration given the very poor overall support for this format from a PC. If you’re using an external device like a games console, Blu Ray player or streaming stick then you can leave this enabled as the screen should correctly switch between the relevant HDR format mode.

Dolby Vision testing coming soon (hopefully)
Measuring and testing Dolby Vision HDR accuracy and set up properly is very tricky. We originally expected to just need an external pattern generator, as you cannot use the built in generator that comes with Calman Ultimate as that only works with HDR10. However, even after getting this set up there appears to be challenges with the support for the DV tunnelling required to measure or calibrate in DV mode on PC monitors. These external pattern generators and software (including alternative professional packages beyond Calman) work fine on TV’s that support DV, but there seems to be added challenges with monitors. This is probably related to that lack of license agreement between Microsoft and Dolby. We are continuing to explore options here to see what’s possible, and come back to test the Dolby Vision performance in the future, and update this review when we can.
HDR10 Testing
HDR picture accuracy

We turned Dolby Vision OFF via the menu for this testing and enabled an HDR input signal from Windows.
Hardly any settings are available in the OSD menu once you’ve enabled HDR mode, except a few within the ‘Custom Color HDR’ mode. The screen has a few different HDR presets to use, available within the ‘display’ section of the menu. There’s modes for Desktop (the default), Movie, Game, Custom Color (which does allow some tweaking of settings a bit), ‘DisplayHDR True Black’ and ‘HDR Peak 1000’.

We tested the default ‘HDR Desktop’ mode which delivered the above results. The tracking of the PQ curve (right hand graph) is not perfect, with a drop below the target line in darker greys being the most noticeable issue, and leading to some loss of shadow detail. We had a decent white point and greyscale colour temp though with a small 3% deviance from the D65 target, being a little too warm. Greyscale accuracy was good overall with dE 1.4 measured.
The PQ performance varies very slightly between the other modes for Movie, Game and Custom Color but not by much at all. The ‘Game’ mode was quite a lot warmer than the ‘Desktop’ and ‘Movie’ modes though at around 5900K.
The mode which delivers a meaningfully different performance though is the ‘HDR Peak 1000’ mode, which we will test in a moment, which is able to reach up to the panels true brightness potential and therefore we suspect the mode that nearly everyone will want to use.

Here’s the same results but from the ‘HDR Peak 1000’ mode. You can see a better PQ tracking now, as well as an improved colour temp and white point, being only a minor 1% out from our target now and being closer to 6500K. This helps improve the greyscale a little further with a dE 1.3 now measured. There’s good accuracy in this mode.
HDR brightness

This is where there is an obvious performance difference when it comes to common white luminance measurements. The Desktop, Movie, Game, Custom Color and HDR400 True Black modes all have a capped peak brightness, well below the panel spec of 1000 nits. We reached around 482 nits maximum in any of those modes which is not very high for a modern HDR monitor of course.

Thankfully the ‘HDR Peak 1000’ mode provides full access to the luminance capability of the panel, now reaching up to 1014 nits peak in our tests.
There is a lot more to HDR brightness though than these simple measurements and we’ve explored these two modes, and provides some possible tricks for forcing a brighter HDR experience on this screen in our separate article here: HDR Brightness Investigation and How to Get a Brighter HDR Experience on the Dell Alienware AW3225QF.
New HDR Brightness Evaluation and Testing Overview
We have also included further HDR tests in this review based on our new testing methodology explained in our detailed article here. These tests are designed to more accurately and thoroughly capture the brightness performance of the display in HDR situations and go far beyond simple, and rather limited “peak white luminance” measurements that are typically provided in the industry. They will include:
- A scale and score based on perceived ‘brightness’ of the display instead of a raw ‘luminance’ measurement. This uses the XCR model and accounts for luminance and colourfulness. XCR and its importance is explained in a lot more detail in our article.
- The scores are now directly related to how you would perceive and feel the brightness of the display. Where a score is twice as high as another score, it means it should appear approximately twice as bright. You can’t treat luminance measurements in the same way as our article explains.
- We will include measurements and brightness scores for colours, not just for white. More important for real-world HDR experience and content.
- Evaluation of the performance and brightness of these colours as the APL changes, including for “peak brightness” capabilities at the smallest APL. This shows where colours remain bright as well as just white measurements, or where you can sometimes get washout issues, or colours which cannot reach as bright as you might expect.
- Colour volume measurements, going beyond simple 2D colour gamut performance and accounting for the brightness variable which is especially important in HDR. This will identify how colours perform at different brightness levels, and is far more telling than only having a gamut coverage figure.
- Comparisons between different displays and panel technologies where applicable

First up is a graph showing the peak brightness capability (relevant for the smallest 1% APL) where both the luminance and colour data have been converted to an XCR score. This represents the perceived brightness you would experience and feel. You can see here that the relative brightness balance between the different colours is good, showing that colour brightness remains high in these “peak brightness” situations. This is made possible by the fact that the QD-OLED panel used in this monitor can deliver high luminance for colours, and also that it has a wide colour gamut.

This is also captured above for different APL and you can see that even for the smallest APL, and the situations where the screen reaches its peak brightness, the colour brightness is strong and can keep up with the white brightness. This is not the case on competing WOLED panels in these “peak” situations, which is something we can analyse by comparing the perceived brightness of colours on the AW3225QF with a few other OLED screens we’ve reviewed. You can click between the tabs for the different comparison graphs and commentary below. Remember, this reflects the actual perceived brightness using XCR scores so the % differences are approximately equal to differences you would see and feel. Far more useful than just raw luminance measurements which are hard to compare.

The Asus ROG Swift PG32UCDM is a small 2% brighter for colours on average, and shows a higher brightness deviation at the maximum 100% APL where this reaches up to 10% higher colour brightness. The same is true for white brightness which reaches around 3% higher on the Asus compared with the Dell. In practice there may be some minor improvements in perceived brightness of colours on the Asus model compared with the Dell, especially for larger APL scenes, but overall the screens are pretty close in brightness capability being based on the same QD-OLED panel, with minor differences to tuning.

The MSI MPG 321URX is around 1.5% brighter for colours overall, and shows a higher brightness deviation at the maximum 100% APL where this reaches up to ~9% higher colour brightness. The same is true for white brightness which reaches around 2% higher on the MSI compared with the Dell. In practice there may be some minor improvements in perceived brightness on the MSI model compared with the Dell for larger APL scenes, but overall the screens are very close in brightness capability being based on the same QD-OLED panel, with minor differences to tuning.

A more interesting comparison is if we compare the 32″ AW3225QF against a typical 27″ 1440p 240Hz WOLED monitor on the market, here we’re using the results from the KTC G27P6. You can see there’s a significant difference in the brightness of colours for the smallest APL, and situations where the screen reaches up to its brightest highlights in dark scenes. In fact the AW3225QF can reach up to 32% brighter for colours in those situations. This is because the WOLED panel on the KTC screen reaches its cap on colour luminance, and can only reach higher overall brightness through the use of its white sub-pixel and “white boost”, which can also cause some washout of colours in those brightest highlight situations. Remember that scenes with APL this low are quite rare in real content, but on occasion it does become evident in dark scenes, with small bright highlights present.
The WOLED panel does have the edge though in overall colour brightness for APL between about 10 – 35% area, being around 2% brighter in those situations, before tailing off more quickly. The larger APL scenes above 35% are then brighter on the AW3225QF’s QD-OLED panel, by around 10% in fact.
The AW3225QF can provide an overall more colourful HDR experience than the 27″ WOLED thanks to its wider colour gamut, and its ability to reach brighter colours in most situations.
HDR colour accuracy


The accuracy of HDR colours relative to the wide Rec.2020 colour space remains consistent really in all modes, but if we focus in on the optimal ‘HDR Peak 1000’ mode (bottom) we can see that the average dE is as low as 0.9 when ignoring the few primary shades which the monitors colour space can’t reach. This is an excellent result and should offer a nice accurate HDR performance.
Conclusion
This is the third 32″ 4K OLED monitor we’ve reviewed and we continue to be really impressed with these new panels and their performance. That combination of 4K resolution, a large screen size and 240Hz refresh rate is great, and likely to be a very attractive spec for many people. We know what to expect by now from these 240Hz OLED screens when it comes to gaming performance, with amazing response times, very good motion clarity and excellent image quality. That’s further enhanced here by the high pixel density and 4K resolution, giving you a very sharp and detailed image. This screen also supports games consoles really well with proper, full bandwidth HDMI 2.1 ports included and features like VRR, and even HDMI-CEC and Dolby Vision HDR offered. Lag was also super-low on this model so it’s well suited to different gaming use-cases.
As we’ve said with our previous reviews of these new 4K panels, the combination of that higher pixel density and gen 3 QD-OLED panel basically eliminates any remaining text issues, and makes the screen more suited to office and desktop applications than older OLED panels. Be wary as ever of the risk of image retention, with this technology still being more aimed at dynamic content and gaming. Dell provide a pretty limited range of OLED care options which feels a little lacking, although their 3 year warranty that includes burn-in cover should give you peace of mind, and Dell are well known for their customer support too.
The uniform brightness operation in SDR mode was pleasing, avoiding any annoying dimming during desktop use. We also like the clean and clear picture quality thanks to the QD-OLED panel’s semi-glossy coating, certainly looking better than current matte anti-glare coated WOLED panels in our opinion. We were sceptical about the curve on this screen before we reviewed it, but actually we found it quite pleasant for general usage, gaming and multimedia. It’s a subtle curve and we don’t have any strong feelings either way between this and the flat panel options on this size to be honest. We don’t like the more aggressive curves on some other screens, but it’s not bad here at all.
We had criticised Dell’s smaller 27″ AW2725DF recently for its lack of added features, which we felt could have helped separate their new model from the wide range of 27″ OLED models on the market already. That criticism was about putting it ahead of the competition in that segment. Here we have a related criticism, but it’s more about this screen keeping up with the competition in this 32″ space. We didn’t feel as strongly about the missing features on the AW3225QF though, as at least there’s proper HDMI 2.1 connections, PiP/PbP modes, Dolby Vision HDR, HDMI-CEC and even eARC sound support included. These are nice extras, and in the case of Dolby Vision and eARC, are currently unique in the monitor market to this screen. We would have liked to have seen USB type-C (with video and power delivery), audio connections, Black Frame Insertion and a KVM switch included here which some competing models offer. It has a decent set of features, but a couple are missing that you may potentially want.
Default setup of the screen was pretty decent in the native mode, and there was a useable and accurate sRGB mode. We’re not really sure what’s supposed to be going on with the DCI-P3 mode, but it doesn’t meet the specified performance targets and is poorly configured. HDR accuracy, brightness and colours were very good and on par with other recent QD-OLED monitors. We have yet to fully test the Dolby Vision mode, but will update this review in the near future with results from that.
| Where to Buy |
| __— |
One final discussion point is of course the price. In the US at the time of writing the screen retails on Dell.com for $1,199.99 USD (affiliate link) . This makes it competitively priced compared with some competing screens, although this does vary by region. MSI’s MPG321URX retails at the moment for $950 USD from various retailers so the Dell is more expensive than their model, but it’s a bit less than the Asus ROG Swift PG32UCDM which retails for $1,300 USD. In the US the decision probably comes down to brand preference, whether you want flat or curved, and whether you want any of the varying features offered by each model.
In Europe and the UK the AW3225QF is available from Amazon at £989.00 GBP at the time of writing, which makes it far more competitively priced than either the MSI or Asus model, which retail for £1,300 and £1,350 respectively at the time of writing. That makes it a very compelling choice in the 32″ 4K OLED space in that region. You can keep an eye on the latest pricing and availability using our provided affiliate links above.

| Pros | Cons |
| Excellent combination of 4K and 240Hz on an OLED panel | Not everyone will want a curved screen format on a non-ultrawide |
| Gen 3 QD-OLED panel and high pixel density makes text very clear | Missing some extras like USB type-C (with DP Alt and power delivery) and KVM switch |
| Additional features like Dolby Vision HDR and eARC sound support on this model | DCI-P3 mode was inaccurately set up |
Further Related Content
- Gen 3 Samsung QD-OLED 2024 Panels and Improvements
- Exploring OLED Brightness – Improvements, WOLED vs QD-OLED and the Need for New Metrics and Specs
- The OLED Black Depth Lie – When Panel Type and Coating Matters
- An Update on All the OLED Monitor Panels
- OLED and QD-OLED Image Retention and Burn-in Longevity Testing at Rtings.com – Our Thoughts and Analysis
- Here’s Why You Should Only Enable HDR Mode on Your PC When You Are Viewing HDR Content
We may earn a commission if you purchase from our affiliate links in this article- TFTCentral is a participant in the Amazon Services LLC Associates Programme, an affiliate advertising programme designed to provide a means for sites to earn advertising fees by advertising and linking to Amazon.com, Amazon.co.uk, Amazon.de, Amazon.ca and other Amazon stores worldwide. We also participate in a similar scheme for Overclockers.co.uk, Newegg, Bestbuy , B&H and some manufacturers.