AOC Gaming Q27G3XMN
Originally published 7 December 2023, last updated 24 September 2024
Introduction
The 27″ 1440p monitor market is one of the most popular and crowded. One area that’s been generally lacking in this segment though is decent support for HDR gaming and movies. Sure, pretty much every monitor is marketed as supporting HDR, but as we’ve covered many times in the past the vast majority of these offer no real HDR hardware capabilities. There’s been far too many displays launched without any backlight local dimming capabilities or means to actually increase the dynamic range of the image, crappy HDR400 certification and offering little more than the ability to accept an HDR signal, even if the screen can’t really do much to display that properly. We’ve started to see OLED monitors appear in the last year or so finally, but in the LCD space while a few have been launched over the years with higher-end FALD (Full Array Local Dimming) and Mini LED backlights, they’ve mostly been reserved to the very top end of the market and carry a hefty price tag.
Things are thankfully starting to change now, and we’re starting to see far more affordable monitors released that feature these high-end HDR backlights. We tested a couple around this time last year in fact in the form of the Cooler Master Tempest GP27Q (1440p model) and GP27U (4K model). We’ve now got a new screen with us from AOC, their Q27G3XMN which has a 336-zone Mini LED backlight to support high-end HDR performance, including certification under the VESA DisplayHDR 1000 tier. That means a high peak brightness of >1000 nits too. It’s a 27″ sized screen with a flat format (not curved) VA technology panel, 2560 x 1440 resolution and 180Hz refresh rate as well. Best of all, this is a really competitively priced screen considering the capabilities and specs. Let’s see how it performs in our testing.
Note: we have updated this review in various places as explained later
| Where to Buy |
 — — |
| We may earn a commission if you purchase from our affiliate links in this content – TFTCentral is a participant in the Amazon Services LLC Associates Programme, an affiliate advertising programme designed to provide a means for sites to earn advertising fees by advertising and linking to Amazon.com, Amazon.co.uk, Amazon.de, Amazon.ca and other Amazon stores worldwide. We also participate in a similar scheme for Overclockers.co.uk, Newegg, Bestbuy and some manufacturers. |
Key Specs
- 27″ screen size, flat format
- 2560 x 1440 resolution
- VA technology panel
- 180Hz refresh rate with adaptive-sync for VRR, inc AMD ‘FreeSync Premium Pro’ certification
- 4000:1 contrast ratio spec
- 336-zone Mini LED backlight
- VESA DisplayHDR 1000 certification including 1000 nits peak brightness spec
- 1x DisplayPort 1.4 and 2x HDMI 2.0 video connections
- Fully adjustable stand with tilt, height, swivel and rotate
Design and Features
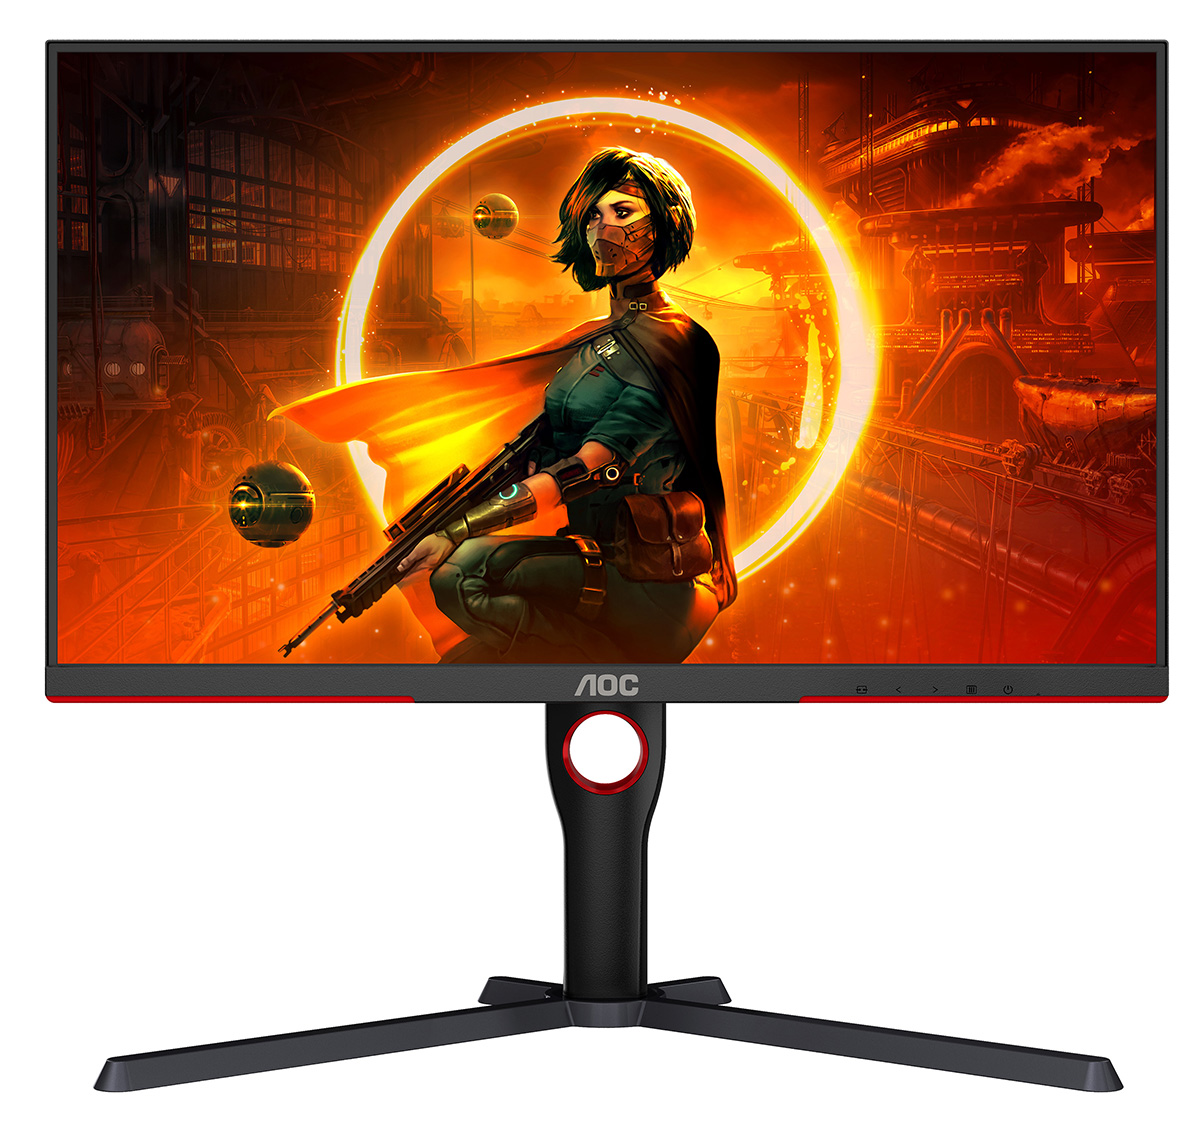
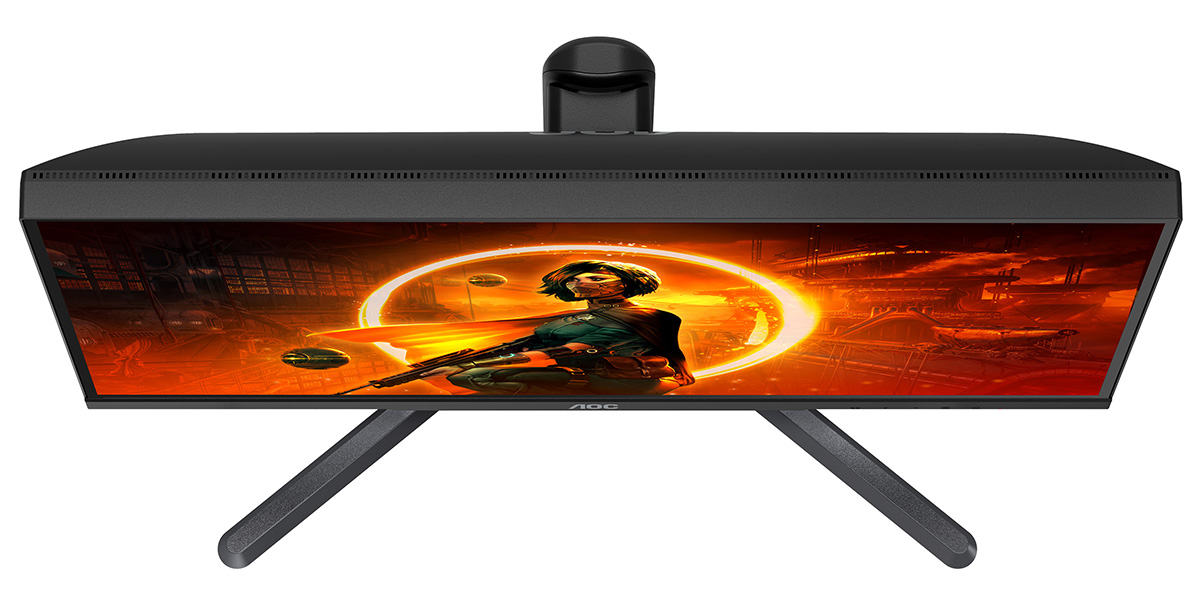
The Q27G3XMN comes in a black finish, with some red highlight sections along the bottom edge of the lower bezel, and inside the cable tidy hole of the stand as shown above. It has a 3-side “borderless” design with a thin plastic edge along the top and sides, but a total black border of ~8mm before the image starts. The bottom edge has a thicker ~20mm matte, black plastic bezel with an AOC logo in the centre. It’s a fairly simple design overall, not overly “gamer”. The foot of the stand is large and a little simple in design, but does provide a wide and stable base for the screen.
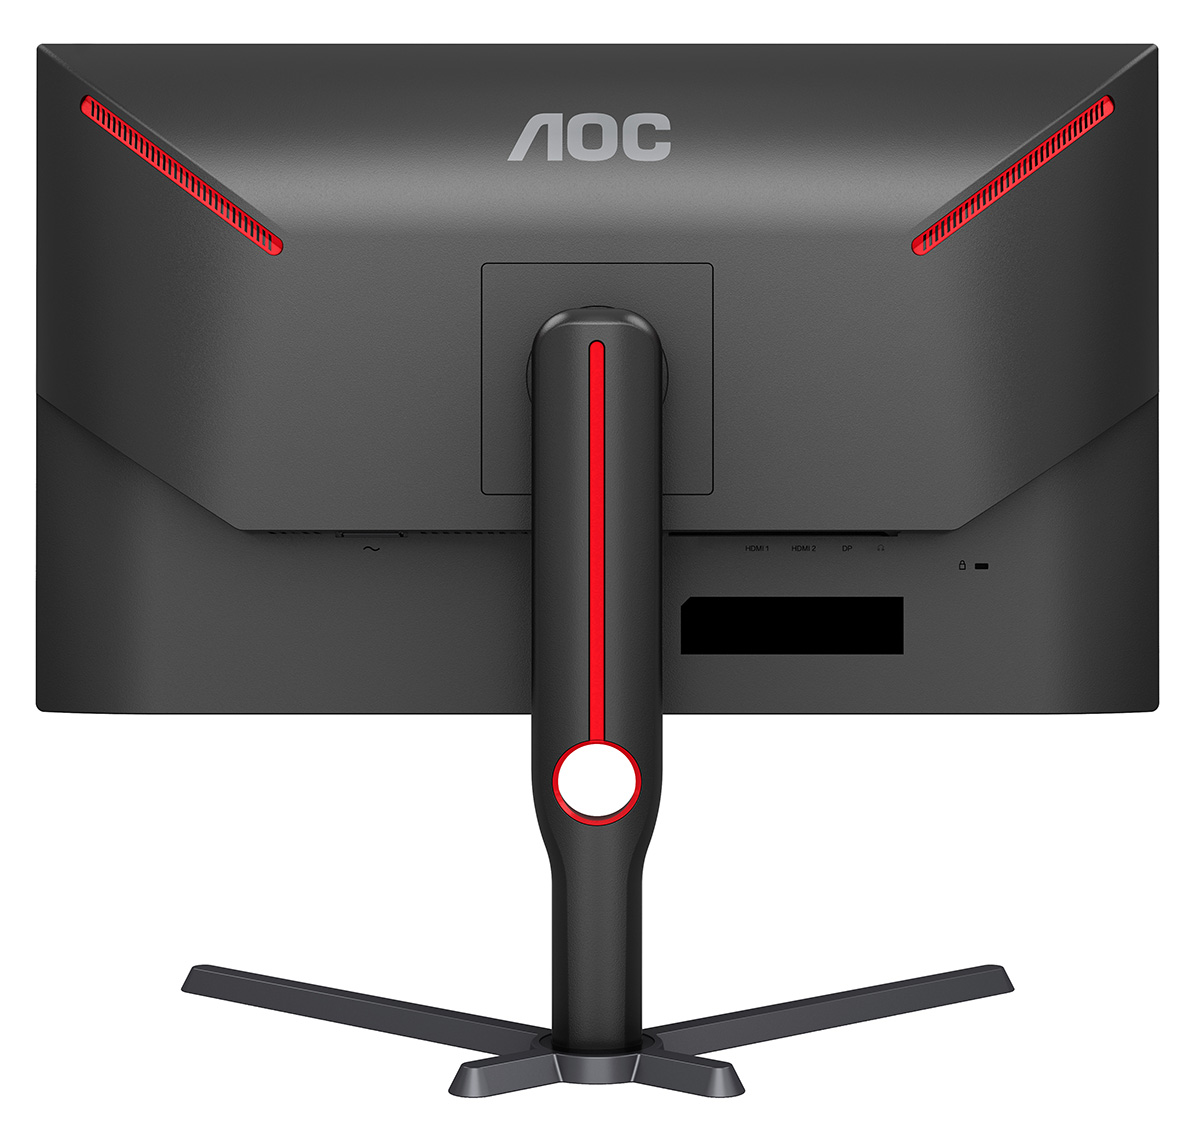
The back of the screen is encased in a matte, black plastic as well with some simple red highlights in places. There’s no RGB lighting or anything fancy like that on this model. The stand has a quick release mechanism and can be removed in favour of 100mm VESA mounting if you’d rather.
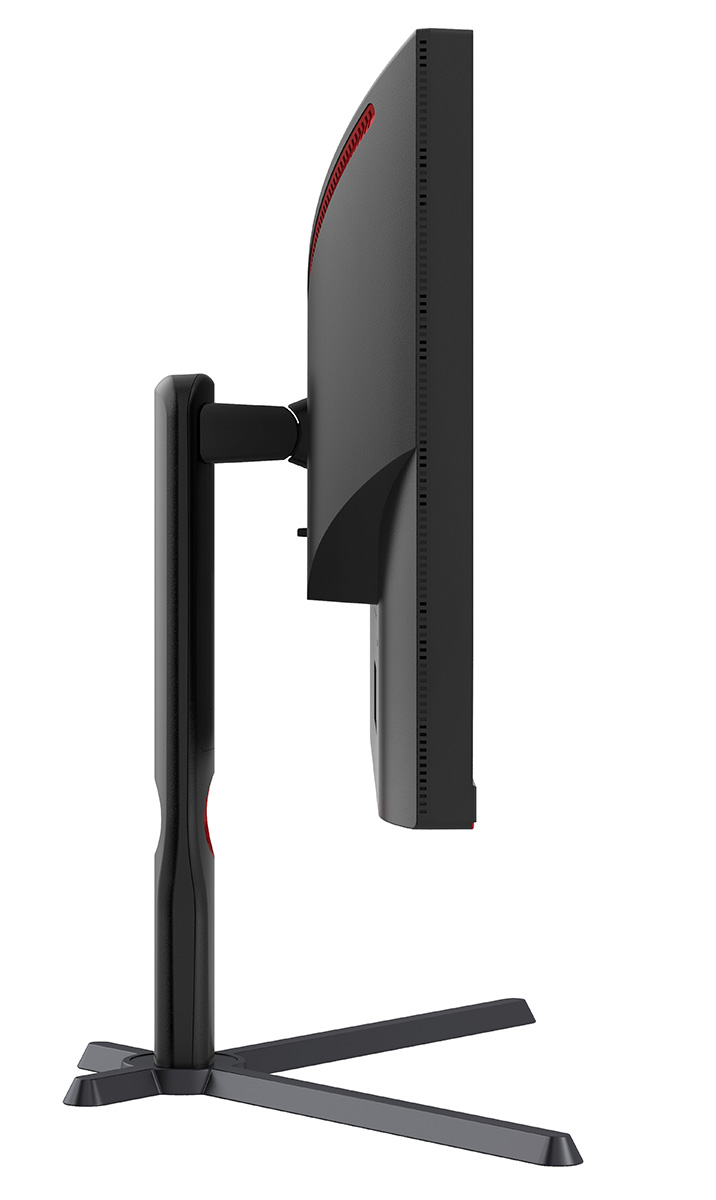
The stand provides a full range of ergonomic adjustments with tilt, height, swivel and rotate available. They’re all pretty smooth and easy to use, although height adjustment is quite stiff. The screen does wobble a bit when you re-position it or use the OSD control buttons, but day to day on your desk it should be fine. The build quality didn’t feel quite as chunky and heavy as some screens in this segment, but that’s probably to be expected given the price tag and the focus on offering a Mini LED backlight at an affordable price.
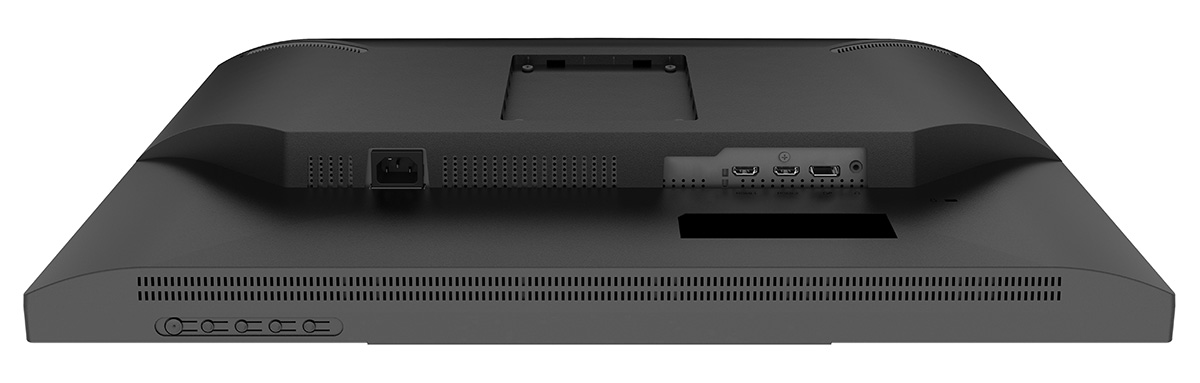
The connections for the screen are located on the back, tucked under the central section as shown above. There’s a limited range of connections here with 1x DisplayPort 1.4 and 2x HDMI 2.0 for video, as well as an audio output. There’s no HDMI 2.1, USB type-C or even USB data ports available on this model which is quite limited in today’s market. Presumably this is one of the areas cut back in order to offer a competitive price point for a Mini LED screen.
You will see here that the OSD control buttons are located on the bottom edge of the screen as well with 4 pressable buttons and a power on/off button. We found these pretty cumbersome to use to be honest, and it’s often hard to know which button you’re using and its position. There are some small etched markings on the front bezel, but these are very hard to see during normal use, so you often find yourself fumbling around trying to press the right one. We found ourselves often turning the screen power off accidentally, not helped by the fact that the power on/off button is not located underneath the power LED on the front bezel where you might think it would be. I’ve lost track of the number of times I’ve cursed while turning the power off accidentally now.
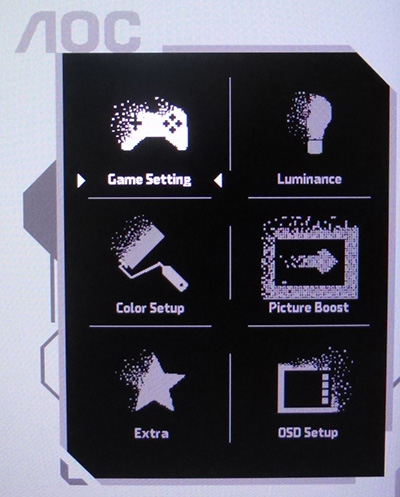
Once in the OSD menu there were a decent range of options available, although the software seems a bit basic, and navigation is sluggish and not very intuitive.
Some options are buried within several layers of scrolling and button pressing too which is a pain. We’d have preferred a small navigation joystick or something here for simpler user experience. There is at least sensible logic to things like HDR mode which will automatically activate when an HDR input is detected, and remembers it’s own separate settings to SDR mode.
Testing Methodology Explained (SDR)

Performance is measured and evaluated with a high degree of accuracy using a range of testing devices and software. The results are carefully selected to provide the most useful and relevant information that can help evaluate the display while filtering out the wide range of information and figures that will be unnecessary. For measurement, we use a UPRtek MK550T spectroradiometer which is particularly accurate for colour gamut and colour spectrum measurements. We also use an X-rite i1 Pro 2 Spectrophotometer and a X-rite i1 Display Pro Plus colorimeter for various measurements. Several other software packages are incorporated including Portrait Displays’ Calman color calibration software – available from Portrait.com.
We measure the screen at default settings (with all ICC profiles deactivated and factory settings used), and any other modes that are of interest such as sRGB emulation presets. We then calibrate and profile the screen before re-measuring the calibrated state.
The results presented can be interpreted as follows:
- Gamma – we aim for 2.2 gamma which is the default for computer monitors in SDR mode. Testing of some modes might be based on a different gamma but we will state that in the commentary if applicable. A graph is provided tracking the 2.2 gamma across different grey shades and ideally the grey line representing the monitor measurements should be horizontal and flat at the 2.2 level, marked by the yellow line. Depending on where the gamma is too low or too high, it can have an impact on the image in certain ways. You can see our gamma explanation graph to help understand that more. Beneath the gamma graph we include the average overall gamma achieved along with the average for dark shades (0 black to 50 grey) and for lighter shades (50 grey to 100 white).
- RGB Balance and colour temperature – the RGB balance graph shows the relative balance between red, green and blue primaries at each grey shade, from 0 (black) to 100 (white). Ideally all 3 lines should be flat at the 100% level which would represent a balanced 6500K average colour temperature for all grey shades. This is the target colour temperature for desktop monitors, popular colour spaces like sRGB and ‘Display DCI-P3’ and is also the temperature of daylight. It is the most common colour temperature for displays, also sometimes referred to as D65. Where the RGB lines deviate from this 100% flat level the image may become too warm or cool, or show a tint towards a certain colour visually. Beneath this RGB balance graph we provide the average correlated colour temperature for all grey shades measured, along with its percentage deviance from the 6500K target. We also provide the white point colour temperature and its deviance from 6500K, as this is particularly important when viewing lots of white background and office content.
- Greyscale dE – this graph tracks the accuracy of each greyscale shade measured from 0 (black) to 100 (white). The accuracy of each grey shade will be impacted by the colour temperature and gamma of the display. The lower the dE the better, with differences of <1 being imperceptible (marked by the green line on the graph), and differences between 1 and 3 being small (below the yellow line). Anything over dE 3 needs correcting and causes more obvious differences in appearance relative to what should be shown. In the table beneath the graph we provide the average dE across all grey shades, as well as the white point dE (important when considering using the screen for lots of white background and office content), and the max greyscale dE as well.
- Luminance, black depth and contrast ratio (static) – measuring the brightness, black depth and resulting contrast ratio of the mode being tested, whether that is at default settings or later after calibration and profiling. We aim for 120 cd/m2 luminance which is the recommended luminance for LCD/OLED desktop monitors in normal lighting conditions. Black depth should be as low as possible, and contrast ratio should be as high as possible.
- Shadow detail – this is evaluated with the screen configured to a 200 nits white luminance for consistency between different monitors, and viewed in a dimly lit room. This first 16 greyscale shades are measured using our UPRTek MK550T spectro device (0.002 nits lower limit) for shades near-black, and the results are plotted on a graph relative to a target gamma curve (usually 2.2 gamma). Where the measurement line crosses the 0.01 nits point on the Y-axis is typically the visual threshold for where we would start to be able to detect luminance compared with black (0.00 nits). We combine these objective measurements with visual tests using a grey shade test pattern to determine the first visible shade, and then rank the shadow detail performance accordingly.
- Gamut coverage – we provide measurements of the screens colour gamut relative to various reference spaces including sRGB, DCI-P3, Adobe RGB and Rec.2020. Coverage is shown in absolute numbers as well as relative, which helps identify where the coverage extends beyond a given reference space. A CIE-1976 chromaticity diagram (which provides improved accuracy compared with older CIE-1931 methods) is included which provides a visual representation of the monitors colour gamut coverage triangle as compared with sRGB, and if appropriate also relative to a wide gamut reference space such as DCI-P3. The reference triangle will be marked on the CIE diagram as well.
- dE colour accuracy – a wide range of colours are tested and the colour accuracy dE measured. We compare these produced colours to the sRGB reference space, and if applicable when measuring a wide gamut screen we also provide the accuracy relative to a specific wide gamut reference such as DCI-P3. An average dE and maximum dE is provided along with an overall screen rating. The lower the dE the better, with differences of <1 being imperceptible (marked by the green area on the graph), and differences between 1 and 3 being small (yellow areas). Anything over dE 3 needs correcting and causes more obvious differences in appearance relative to what should be shown. dE 2000 is used for improved accuracy and providing a better representation of what you would see as a user, compared with older dE methods like dE 1994, as it takes into account the human eye’s perceptual sensitivity to different colours.
Updated Testing Sept 2024
We originally reviewed this screen in December 2023 and one fundamental problem we found with the screen was the lack of any true sRGB emulation or colour space clamp. Using the sRGB mode still resulted in the full native gamut of the backlight being used, it was not clamping back to sRGB as intended. We know other UK-based reviewers who have since reviewed the screen and found the same thing, based on different samples of the screen too so it wasn’t isolated to our test sample. However, this was in contrast to the review at Rtings.com, who are based in Canada, whose review found that their unit did have a working sRGB emulation clamp.
We fed this back to AOC and over many months we have been back and forth with them to understand what happened, why UK and Europe review samples seemed to be affected by this issue, and most importantly try and understand what impact this would have on someone who buys the screen from retail stock. AOC have now confirmed the situation:
- The monitor samples sent to reviewers in Europe were a production sample that was expedited ahead of retail mass production and regular shipments. This included our sample as we are UK-based.
- It was from the regular production line but required a firmware update after arriving in Europe to match the final firmware being used for the mass production units going to retailers.
- A firmware update was applied at AOC’s Amsterdam office and warehouse to (expectedly) align the European review samples with the latest production firmware before they were shipped out to reviewers. Only later after this problem was discovered did they learn that this particular update could only be properly implemented on the production line itself, not one that could be applied afterwards manually. This left the screen with some setup issues, most notably the missing sRGB emulation clamp.
- The retail units available in both US and Europe were not affected though, it was only these very early European reviewer samples. As such you should not be worried about buying the screen in any region, all retail stock should be fine.
In light of this, AOC also sent us out a second unit from retail stock to re-test, so we have updated the review in a few sections below where indicated. We have kept the original data and results for reference as well since this review has been live for 9 months now. We do however want to more accurately measure the performance an end-user can expect which is why we’ve updated this review now. AOC tells us they’ve learnt from this experience and adjusted their processes to prevent similar issues in the future, and commented that they always aim to ensure reviewers are provided with products that accurately represent what customers will purchase.
Default Setup
Section updated Sept 2024
Since the new firmware included updates for the sRGB factory calibration mode, we also re-tested the default ‘native’ mode to see if this was any different. It was.
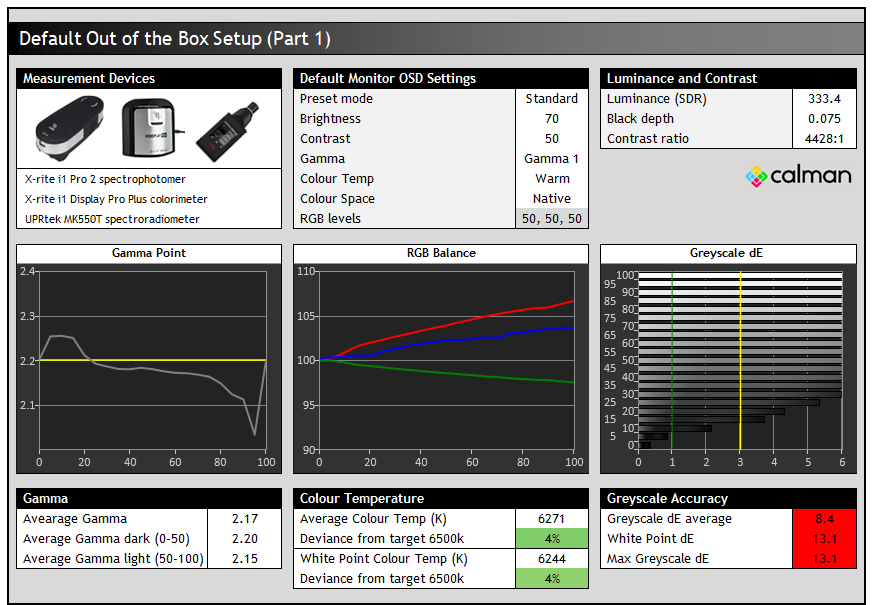

The default out of the box setup is decent overall now with the final retail firmware and quite a bit better than we’d seen before when we originally tested the early sample of the screen. Gamma tracking is good with 2.19 average measured, although you can see it’s a bit too low near black. The RGB balance was weighted a little towards the red channel, although giving us a slightly too warm greyscale, and a white point with a 7% deviance from our target at 6032K. Unlike the original testing last year, there’s no noticeable pink or red tint to the image or greyscale any more which is great news. We also had a much better overall greyscale accuracy with dE 2.6 average, although the highest error is with white which reaches 5.3 dE.
There’s a very high static contrast ratio of 3565:1 which is impressive, thanks to the VA panel. This had actually been a fair bit higher on the original testing, but with the improvements in RGB balance and gamma, it seems to have dropped a bit here. It’s still very impressive and far beyond any TN Film or IPS panel. The screen is bright by default at its 70% setting though and you’re likely to want to turn that down a lot. We measured a brightness adjustment range from the screen between a very high 657 cd/m2 max, and a reasonably low 81 cd/m2 which was a very wide range; and that’s with the Mini LED local dimming turned off in SDR mode. This should afford you a wide adjustment range to use the screen in different ambient lighting conditions, although it could perhaps have offered a little more flexibility for darker room conditions. If you want to use the screen in very bright environments, the high upper range is excellent.
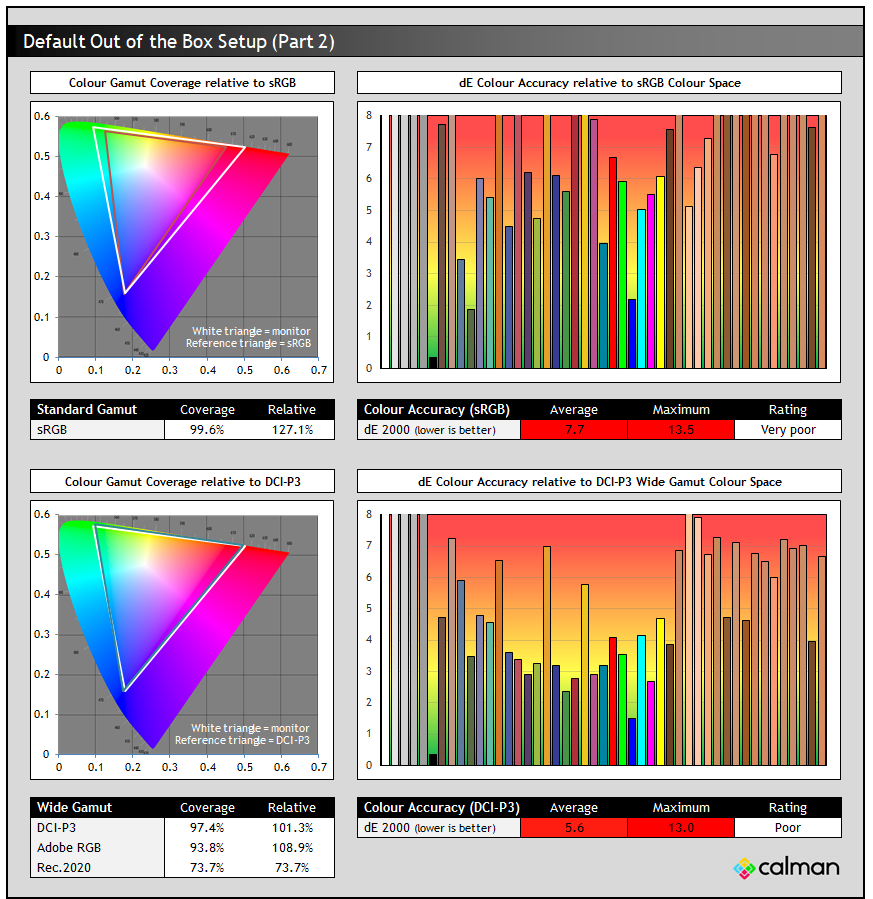

From a colour point of view you can see from the top left CIE diagram that the screen’s colour space extends quite a long way beyond the sRGB reference space with 131% relative coverage measured. This leads to over-saturation of green and red shades, and when measuring the accuracy of sRGB colours we have a poor dE of 4.5 average. This is caused by that larger colour space of the monitor, which is typical and to be expected. It’s better than the original testing though where dE was also impacted a lot by the poor colour temp and RGB balance.
You can see from the bottom left CIE diagram that the monitor’s native colour space quite closely matches the DCI-P3 reference, and we measured 97.4% absolute coverage, with only a small amount of over-coverage leading to a 104.5% relative coverage measurement. This should in theory make the screen well suited to DCI-P3 content like a lot of HDR material, and we had a reasonable colour accuracy for DCI-P3 colours with dE 2.7 average, 5.1 max. Again this was far better than the original testing last year. The final retail stock firmware made some nice improvements thankfully in these areas.
The screen has a reasonable coverage of the Adobe RGB reference space at 95.0%, and is therefore reasonably well suited to working in that colour space for professional and photography work, although can’t quite cover all of the reference space. There is no provided Adobe RGB mode or clamp in the menu, so you’d need a calibration device to be able to profile the screen for colour aware applications if you wanted to work with Adobe RGB content specifically.
sRGB Emulation Mode (including Factory Calibration)
Section updated Sept 2024
We’re starting to see a trend with these factory calibration reports being shipped with monitors nowadays, and we’d like to see things improved from various manufacturers. We commented in several of our recent reviews including for the Asus ROG Swift PG49WCD, Asus ROG Swift Pro PG248QP and KTC G27P6 for instance about how some of the information on the reports was wrong, confusing or hard to understand. It’s the same problem here with the AOC Q27G3XMN unfortunately. We’re not meaning to moan about this and it ultimately doesn’t change how the screen performs, but hopefully manufacturers can take some of this on board as constructive criticism to improve the overall customer experience.
Here’s the calibration report provided with this screen (from the second sample we tested in Sept 2024):

- This report suggests that the screen has been factory calibrated for sRGB accuracy with a dE <2.
- Why are the labels on the CIE diagram not in English like the rest of the report? The dotted triangle is supposed to represent the sRGB colour space, while the full line is the monitor’s gamut.
- In the second table down it suggests the ‘color temp’ should be set to sRGB – there isn’t an sRGB colour temp mode to select!
- It then suggests the ‘measurement condition’ is “set to sRGB Mode on OSD Menu”. There is an sRGB mode in the ‘color gamut’ section so it must mean that.
- In the following table it suggests you need to set contrast to maximum as well! We’re not sure why you’d want to do that, but contrast isn’t an available option to change when running in sRGB mode anyway, it’s greyed out and locked at the default 50.
- The table underneath this then lists the colour gamut coverage, although they’ve made this pretty confusing by mixing CIE 1931 measurements for sRGB (99.7%) and then CIE 1976 for DCI-P3 (97.6%) and Adobe RGB (94.8%). Stick to one or the other please, preferably CIE 1976.
- These coverage specs don’t reflect a standard gamut/sRGB mode though. 97.6% DCI-P3 coverage would be wide gamut operation! The CIE diagram on the sheet also suggests the monitor’s gamut extends beyond sRGB by a lot. This makes it very confusing to understand which mode the report is talking about.
Anyway, on to the measurements in the sRGB colour gamut mode:


When you switch to the sRGB gamut mode most of the other OSD settings are locked. You thankfully still have access to the brightness control, but other settings for gamma, colour temp etc are now greyed out. You can see that the final retail stock firmware offered much better performance for gamma, greyscale and colour temp than our original testing which was great news. It was quite similar to the default ‘native’ mode, although the white point was a bit better here and now only 3% out from the 6500K target.


The most significant change to this review with our updated testing in Sept 2024 is with the colour space in this sRGB mode. We are pleased to confirm that the clamping now works properly and you get a decent sRGB emulation. You can see from the old test data that the obvious issue before with this mode was that it didn’t change the gamut at all, and the sRGB clamp was not working.
Previously with the lack of any sRGB emulation, the accuracy of sRGB colours remains poor since there was significant over-saturation of green and red shades in particular in the native gamut mode, as well as the RGB balance and greyscale being poor before. Thankfully with the updated tested we can see good colour accuracy now that the colour space emulation is active, with a dE 1.9 average. This meets the dE < 2 spec too. To clarify again, ALL retail stock in all regions should have this working sRGB emulation mode. Only early European press samples were impacted by the issue.
SDR Local Dimming
Section updated Sept 2024
AOC provide the option to enable the local dimming backlight even in SDR mode, which could potentially be useful for gaming and multimedia. We wouldn’t really recommend using it for general uses, photography, professional applications etc as it could impact your accuracy, but it can give you a nice contrast and visual boost for dynamic content. It can offer impressive increases to contrast in those situations as the backlight can be turned right down in the areas it needs to in order to produce much deeper blacks.
When you enable local dimming in SDR mode you do not get an increased peak brightness compared to SDR mode though (like you did on the Mini LED Cooler Master Tempest GP27U for instance), and actually the maximum drops a bit compared with having local dimming turned off. The maximum brightness capability of the screen is still very good though and more than enough for SDR content. This is preferable operation though for SDR local dimming, as you don’t want the screen going massively brighter when the tone mapping is not there like it is for HDR, it just makes it very difficult to use. Here, you can just leave the screen brightness at a comfortable setting, and instead benefit from the local dimming improving the black depth, and therefore contrast ratio. This works very well.
For these tests we would normally switch to the sRGB gamut mode, as SDR content is based on that colour space and it would provide more accurate colours as as result. However, with that sRGB emulation seemingly not working at the moment, we stuck with the native gamut mode for these tests. We first of all tested the brightness range and improved contrast with local dimming enabled in each of the three modes available in the menu. We used a 10% area APL for this test:
| Local Dimming Setting OSD setting | Max 100% (nits) | Min 0% (nits) | Local contrast | Max full screen contrast |
| Off | 657 | 81 | ~3500:1 | ~3500:1 |
| Low | 559 | 69 | ~8100:1 | ~13,000:1 |
| Medium | 551 | 67 | ~8300:1 | ~44,000:1 |
| Strong | 546 | 67 | ~8600:1 | ~125,000:1 |
The brightness levels possible are basically all the same with local dimming enabled at around 550 nits maximum, but this is about 100 nits lower than if you disabled local dimming. You can set the screen to a comfortable brightness for your content in either mode though.
There are decent improvements in the contrast ratio now that dark areas can be dimmed more effectively by the Mini LED backlight. The local contrast (between adjacent light and dark areas) was improved a decent amount to ~8000:1 to 8600:1 depending on the setting, a decent step up from the screens native ~3500:1 with local dimming turned off. Max screen contrast (areas measured far apart from one another) reached up to a very impressive ~125,000:1 maximum in the highest local dimming setting of ‘strong’. This mode delivered the deepest looking blacks in visual tests too and so seems to be optimal. This shows how much the Mini LED backlight can improve the contrast ratio in real use, even in SDR content.
We also measured the setup in the Native mode but with the local dimming enabled. We left everything else at default for now.


Despite everything else in the OSD being left at default, there are some differences with performance when you turn local dimming on. The gamma is now quite a bit higher than before, measured here at 2.49 average. You may even want to move to the gamma2 setting if you’re using local dimming in SDR mode, as that would now be closer to 2.2 (it had been ~2.0 before with local dimming off).
The colour temp had also become a bit cooler than the off mode, measured at 6651K average across the greyscale (2% deviance from the target) and at 6727K for white point (3% deviance). Whereas it had been a bit too warm at 6203K / 6032K with local dimming off. This slightly cooler appearance and colour temp was a result of the raising of the blue channel it seemed. This was better than in our original testing from Dec 2023 though.
Calibration
Section updated Sept 2024


Calibration and profiling can produce excellent results if you have a suitable calibration device and software. This was profiled to 2.2 gamma, 6500K colour temp and to the sRGB colour space. The screen was left in its native wide gamut mode, but this profile will be used in colour-aware applications (e.g. Photoshop) to map back to sRGB in this instance.
Overall the calibrated results were excellent as you’d hope. This calibration had now corrected the gamma nicely as well as significantly improve the colour temp, greyscale accuracy and colour accuracy. You can find our calibrated settings and ICC profile in our ICC profile database now which should help you get a much better setup than the default mode.
General and Office
The VA-type panel used for this screen offers some decent all round performance including fairly wide viewing angles and a stable image quality that you’d expect from this technology. It’s not quite as good as an IPS panel, and you get more noticeable colour tone and gamma shifts as you move your viewing position, but it’s clearly far better than TN Film panels. This gamma shift, especially vertically may lead to some loss of detail in some situations, especially darker scenes and you also get the familiar off-centre VA gamma shift where dark shades can get crushed when viewing the screen head on. This is inherent to all VA panels though and relates to their liquid crystal orientation. Darker content was much better than an IPS panel though as it was free from the familiar off-angle IPS pale glow associated with that technology. Combined with the much higher contrast ratio and deeper blacks, it’s much better at handling darker content as a result.
The resolution of 2560 x 1440 is also comfortable on a 27″ sized screen providing a nice desktop area to work with, including decent support for split screen working and a sharp text clarity. While there are some 27″ 4K options available, we think that 1440p is perfectly fine for most people on a 27″ screen like this, providing a sharp and crisp image and definitely offering a big step up from 1080p. It has a comfortable text size and a very good image quality. The screen has a light matte anti-glare (AG) coating which is the same as other modern VA panels.
We confirmed a flicker free backlight operation at all brightness levels, and also when local dimming is being used which was great news. No need for PWM dimming here:

The wide colour gamut provides flexibility to work with a range of different colour spaces if you need to. The native wide gamut is useful for gaming, HDR and multimedia where you might well prefer the more saturated and vivid colours, and especially for HDR content which is mastered in the DCI-P3 or even wider Rec.2020 colour space. The native gamut of the panel closely matches this DCI-P3 reference space. There is around 95% coverage for Adobe RGB which is reasonable, and should be sufficiently large enough to make the screen practical for working with content in that specific gamut if you need. Although in the absence of a specific emulation mode, you will need a calibration tool to achieve this.
Thankfully the final retail stock of this screen includes a functioning, and accurate sRGB emulation mode, despite our original testing from Dec 2023 when we first reviewed this screen.

The spectral distribution at a calibrated 6500k is shown above, with the blue peak measured at 449 nm wavelength and a 30.15% blue light percentage. This means it is not part of the Eyesafe certified range of products, as it does not have a blue peak that is outside of the supposed harmful range according to Eyesafe which is 415 – 455nm.
There is a ‘LowBlue mode’ setting in the OSD menu which can be accessed via the ‘color setup’ section. There are 4 modes which get progressively warmer and more yellow in appearance. They are, along with the measured white point: multimedia (6073K), internet (5615K), office (5232K) and reading (4878K). These may be useful if you want to quickly switch to a warmer mode for late night office or text work.
The screen has a decent range of ergonomic adjustments with tilt, height, swivel and also rotate available. Connectivity and related functionality is limited by today’s standards with only DisplayPort 1.4 and HDMI 2.0 available. There’s no USB type-C connection, KVM support or PiP/PbP modes on this screen unfortunately which are often useful for office and general use. It does have an audio output connection but no integrated speakers, and not even any USB data ports which could have been useful for office work.
Gaming
| (at native resolution) | Refresh Rate |
| Maximum Refresh Rate DisplayPort | 180Hz |
| Maximum Refresh Rate HDMI | 144Hz |
| VRR range | 48 – 180Hz (DisplayPort) 48 – 144Hz (HDMI) |
The Q27G3XMN offers a mid-tier refresh rate at 180Hz maximum. This is supported by adaptive-sync for variable refresh rates (VRR) from compatible NVIDIA and AMD systems. It’s been certified under the AMD ‘FreeSync Premium Pro’ scheme which should give you some reassurance around VRR performance as well. 180Hz is certainly a significant step up from 60Hz screens and a bit above common 120 / 144Hz displays too in terms of motion clarity and frame rate support. There are however plenty of higher refresh rate screens available today, although not many with Mini LED backlights, and certainly not in this price bracket.
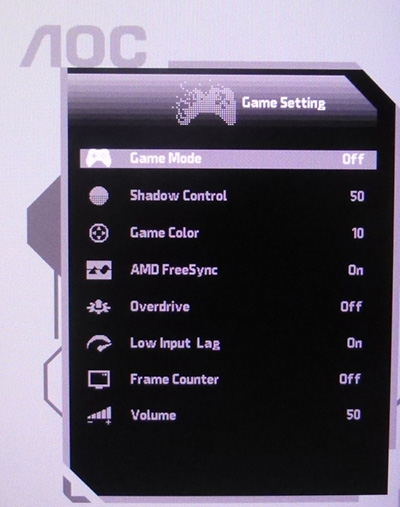
There are 4 overdrive modes available in the OSD menu (off, weak, medium, strong) although quite oddly the screen comes out of the box in the ‘off’ mode, so you’ll want to change that for gaming. Note that there is no blur reduction mode offered on this screen.
| VRR capabilities and Certification | |
| AMD FreeSync Premium certification | FreeSync Premium Pro |
| Native NVIDIA G-sync module | |
| NVIDIA ‘G-sync Compatible’ certified | |
| VESA ‘AdaptiveSync’ certification | |
| HDMI-VRR (consoles via HDMI 2.1) |
The VA panel is well suited to handling darker game titles with strong contrast ratio and black depth, considerably beyond high refresh rate IPS panels. The near black shadow detail was reasonable but it was hard to pick out very dark grey shades in this test image with box 4 being the first that was easy to distinguish. This was improved nicely after calibration with our ICC profile though. There is a ‘Shadow Control’ setting in the OSD menu as well, but this makes quite drastic changes to the black level, even with just one step up from the default 50, to a setting of 60. It might help darker games look brighter, but it does spoil black depth at the same time.
The Mini LED backlight is well-equipped to support HDR gaming with 336 zones of local dimming delivering significantly improved contrast ratio in practice. There’s loads more measurements for HDR mode including accuracy, colours and brightness in the section that follows.
Our thanks to the following manufacturers for support in the build of our new test system:
| AMD Ryzen 9 7950X | Buy AMD Ryzen 9 CPUs here on Amazon | |
| Asus ProArt B650-Creator | Buy Asus B650 motherboards here on Amazon | |
| Corsair DDR5 RAM | Buy here on Amazon | |
| Corsair H100i Elite Capellix AIO cooler | Buy Corsair coolers here on Amazon | |
| Corsair iCUE RGB Elite Fans | Buy here on Amazon | |
| NVIDIA RTX 3090 | Buy NVIDIA RTX graphics cards here on Amazon |
| We may earn a commission if you purchase from our affiliate links in this content – TFTCentral is a participant in the Amazon Services LLC Associates Programme, an affiliate advertising programme designed to provide a means for sites to earn advertising fees by advertising and linking to Amazon.com, Amazon.co.uk, Amazon.de, Amazon.ca and other Amazon stores worldwide. We also participate in a similar scheme for Overclockers.co.uk, Newegg, Bestbuy and some manufacturers. |
Response Times
As discussed in our detailed article about Response Time Testing – Pitfalls, Improvements and Updating Our Methodology we are using an improved and more accurate method for capturing G2G response times and overshoot, based on figures that are more reflective to what you see visually on the screen in real-World usage. Our article linked above talks through why this is better and how we arrived at this improved method in much more detail.

We first of all measured the screen at its maximum 180Hz refresh rate, in each of the 3 overdrive modes (ignoring the ‘off’ mode). There’s fairly mediocre performance in the ‘weak’ mode with only 6.3ms G2G measured, although there was basically no overshoot in this mode at all. Shifting up to the ‘medium’ mode brought about some positive improvements with a 5.2ms G2G average now measured. There was only very slight overshoot measured, but this wasn’t something you could see at all during normal use. There was some minor improvement in motion clarity moving between the ‘weak’ and ‘medium’ modes. There was some moderate dark smearing though in both these modes, caused by the slower transitions along the top row of the table from black > grey. This was not as bad as many VA panels though, but you could still detect it in certain situations and on certain colour transitions. Some pursuit camera photos capturing real-world perceived motion clarity, and this black smearing, are included below. We found this one of the better VA panels though for black smearing.
Moving up to the maximum ‘strong’ mode brought some decent visual improvements, with most of the darker smearing now eliminated which was great news. At 180Hz it was hard to notice any major issues with overshoot, although some slight pale halos were starting to appear in some situations. You can see from our measurements that there were however moderate-to-high errors now on many transitions so there’s a chance this could be noticeable in certain gaming situations. If you’re playing at a fixed 180Hz refresh rate you may want to experiment with the medium and strong modes, and as long as you don’t see any issues with overshoot it’s probably better to try the strong mode. However for anything lower, or in VRR situations it’s not a good choice.
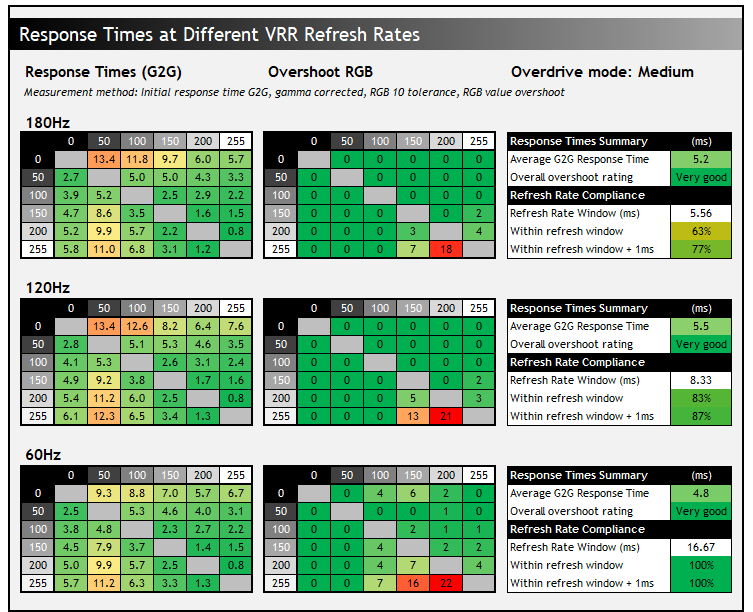
We then measured the response times during VRR situations. When using the ‘strong’ mode (which had performed moderately well at 180Hz), you can definitely see major issues with overshoot halos and trails as the refresh rate drops, and they are very visible and distracting. As a result, the ‘medium’ mode is definitely optimal for VRR gaming, or for any lower refresh rates, and this delivers consistently good results across all refresh rates without any visible overshoot in practice. That means a nice simple single overdrive mode experience which is great news. There is a bit more black smearing than the Strong mode, but it’s only at fairly low levels on this screen compared with many VA panels we’ve tested. It’s definitely better to use this mode for VRR and lower refresh rates though to avoid the high overshoot in the strong mode.
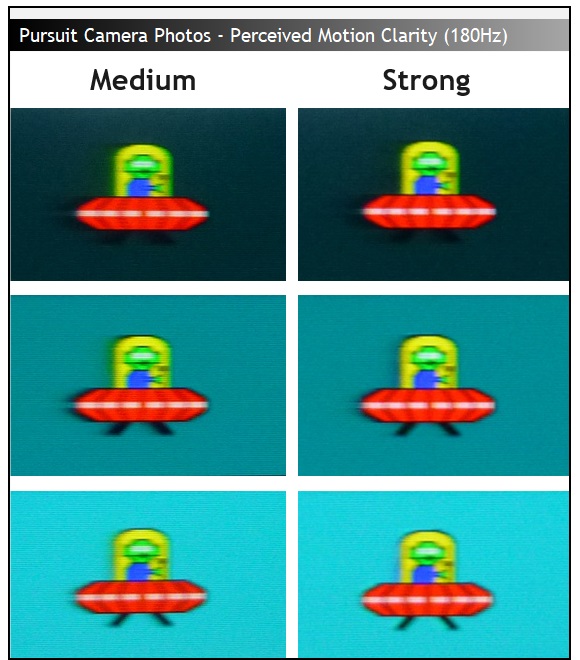
The motion clarity of the screen was good, looking the best at 180Hz in the strong mode as we said above. There;s some slight pale overshoot becoming visible on the lighter coloured backgrounds in that mode but it’s fairly subtle. The problem with the strong mode is that for any lower refresh rate, and during VRR situations when the frame rate drops, the overshoot becomes very noticeable. The medium mode has a bit more black smearing as the response times are a bit slower, although there’s no visible overshoot in that mode. The level of black smearing is pretty low though here, compared with most VA panels. You can see the higher levels of black smearing of the last VA monitor we tested here for example, on the ASRock PG34WQ15R3A.
Input lag
Read our detailed article about input lag and the various measurement techniques which are used to evaluate this aspect of a display. The screens tested are split into two measurements which are based on our overall display lag tests and half the average G2G response time, as measured by our oscilloscope. The response time element, part of the lag you can see, is split from the overall display lag and shown on the graph as the green bar. From there, the signal processing (red bar) can be provided as a good estimation of the lag you would feel from the display. We also classify each display as follows:
Lag Classification (updated)
- Class 1) Less than 4.17ms – the equivalent to 1 frame lag of a display at 240Hz refresh rate – should be fine for gamers, even at high levels
- Class 2) A lag of 4.17 – 8.33ms – the equivalent of one to two frames at a 240Hz refresh rate – moderate lag but should be fine for many gamers. Caution advised for serious gaming
- Class 3) A lag of more than 8.33ms – the equivalent of more than 2 frames at a refresh rate of 240Hz, or 1 frame at 120Hz – Some noticeable lag in daily usage, not suitable for high end gaming
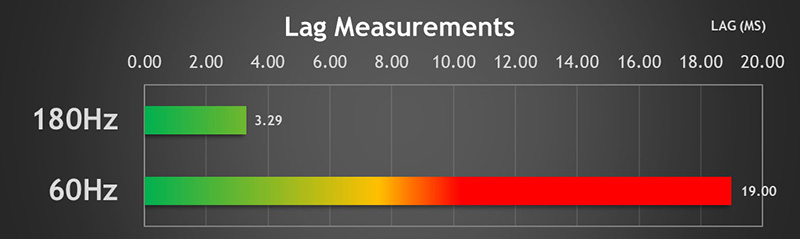
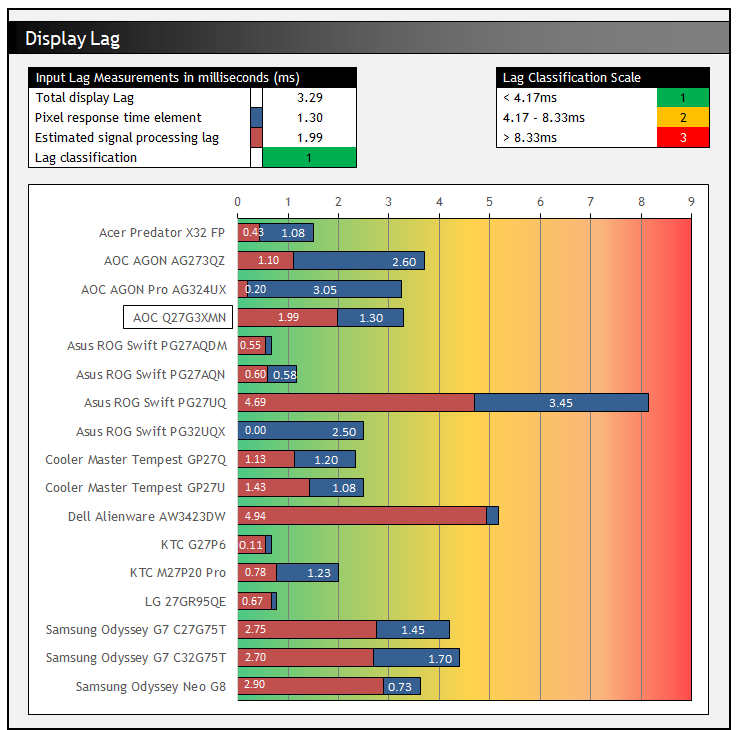
We measured the total display lag at the native 180Hz, as well as at 60Hz so that we can consider external input devices like old games consoles and Blu-ray players. The lag at 180Hz was good with a total of 3.29ms display lag recorded. Around 1.3ms of that is accounted for by pixel response times, leaving an estimated signal processing delay of ~1.99ms. This should be fine for most gamers. At 60Hz the lag was quite a lot higher, as is typical for most monitors, measured at 19ms total.
HDR (High Dynamic Range)
| HDR Technical Capabilities | ||
| VESA DisplayHDR certification level | DisplayHDR 1000 tier | |
| Multiple HDR formats supported | HDR10 format only | |
| Local dimming | | 336-zone Mini LED backlight |
| High number of local dimming zones | | 336 zones |
| Increased peak brightness | | 1365 nits max measured |
| Reaching advertised peak brightness | 1000 nits advertised | |
| Increased dynamic range (contrast) max | | ~280,000:1 |
| Increased “local” HDR contrast ratio max | | ~11,500:1 |
| Wide colour gamut >90% DCI-P3 | | 97.4% absolute / 101.3% relative |
| 10-bit colour depth support | | Supported |
One of the key benefits of the Q27G3XMN is its 336-zone Mini LED backlight which sets it apart from common edge-lit local dimming monitors, which only have a very limited number of dimming zones, commonly 8 or 16. Mini LED backlights provide a much better control over the image on the screen, being able to dim smaller parts of the image while brightening other areas to improve the brightness, contrast and dynamic range. Dark areas can often be dimmed so low that they are basically being turned off, while bright highlights can often be brightened to very high peak brightness levels. That’s one of the key benefits in using a direct lit backlight with many zones like this.
Each zone on this screen is responsible for around 10,971 pixels given the 1440p resolution which obviously isn’t as finite in control as something like OLED which has per-pixel level dimming control. Having said that, a Mini LED backlight is capable of reaching much higher brightness levels, including sustaining those brightness levels for larger screen areas without the impact of ABL on OLED panels, so each technology has its advantages and limitations. The 336 zones used here is good though on a screen this size, not quite as high as we’ve seen on some models in the past which often have around 500 zones. This number of zones helps reduce blooming and halos in practice relative to edge-lit dimming or those with far fewer zones. There can still be challenges on very specific content like star fields for instance, or scenes with very small bright areas, but that’s going to be hard for any FALD screen to handle and you really need something like OLED to avoid all halos.
- Related content: Here’s Why You Should Only Enable HDR Mode on Your PC When You Are Viewing HDR Content
Normal use HDR content looks very impressive, with images that pop with nice colours, some very bright areas, and very low levels of blooming and halos from what we could see. We tested the local dimming in both SDR mode (where it is available to use if you want) and HDR, and the blooming was consistently low. Halos were small and the Mini LED backlight did a very good job of brightening light areas, and darkening dark areas. The ‘Strong’ local dimming mode offers the best performance we felt, making blacks slightly darker than the ‘low’ and ‘medium’ dimming settings and improving the overall contrast of the image. We saw a bit of flickering to the image when this was enabled but only in static uses for some reason, and when switching between different applications. During dynamic content, which is where this should really be used, we didn’t see any issues with this during our usage.
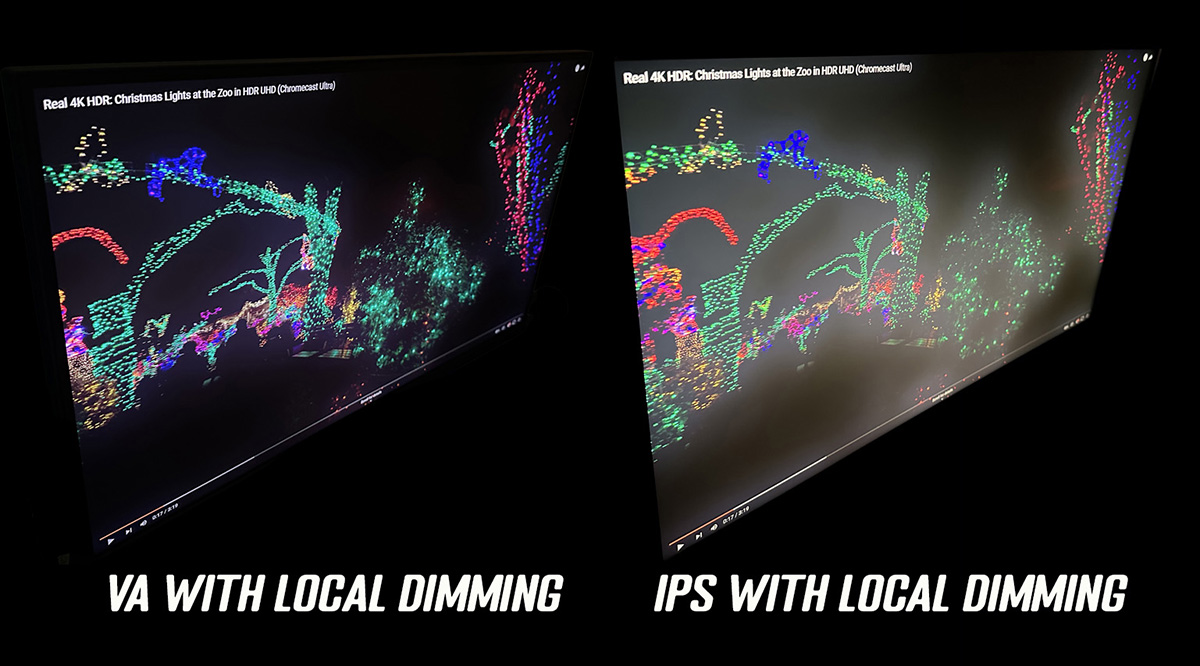
One significant benefit for HDR is linked to the use of a VA technology panel here and that is because of the viewing angles. Above is a photo of a VA panel with local dimming on the left, and an IPS panel with local dimming on the right. Both look pretty similar from a head-on viewing position, and show low levels of blooming. But when you view them from the side or any off-angle in fact, the IPS glow caused by that panel’s viewing angle characteristics is very obvious. It causes obvious visual blooming around brighter areas, but this is not because of the backlight on its own (this blooming is not visible from head-on), but caused by the IPS panel its been paired with. You don’t get the same issue on VA panels at all, and this is a key reason we think VA is more suited to Mini LED HDR displays than IPS is. Don’t forget you also get a higher static contrast ratio with the VA panel too, so overall dynamic range is also likely to be higher than an IPS equivalent. That viewing angle-related blooming is certainly an obvious benefit though.
We also measured the performance of the HDR mode.
Most OSD settings become locked when you enable an HDR input source, including brightness, contrast, colour temp etc. There are 4 different HDR modes you can select from within the ‘luminance’ menu though – DisplayHDR, HDR Game, HDR Movie and HDR Vivid. The performance is largely the same in each of the 4 modes although the PQ tracking is a little different as covered below. Brightness and colour temp appear to be the same in all 4 modes. For some reason the Gama/Movie/Vivid modes have an accentuated sharpness to the image too, although there’s no setting anywhere in the OSD menu that allows you to adjust this. We preferred the visual appearance of the default ‘DisplayHDR’ mode to be honest.
Note that for these tests we used the ‘strong’ local dimming mode, although this has no impact on the results other than the contrast ratio figures.

The setup in the DisplayHDR mode was very good overall with a nice accurate RGB balance resulting in a decent white point of 6627K (2% deviance from target) and an average colour temp of 6802K (5% deviance) across the greyscale. This was slightly too cool but not by much. We had a very good greyscale accuracy though with dE 1.2 average measured. Tracking of the PQ curve was pretty good, although it was a bit dark in dark to mid grey shades, dropping below the target line.
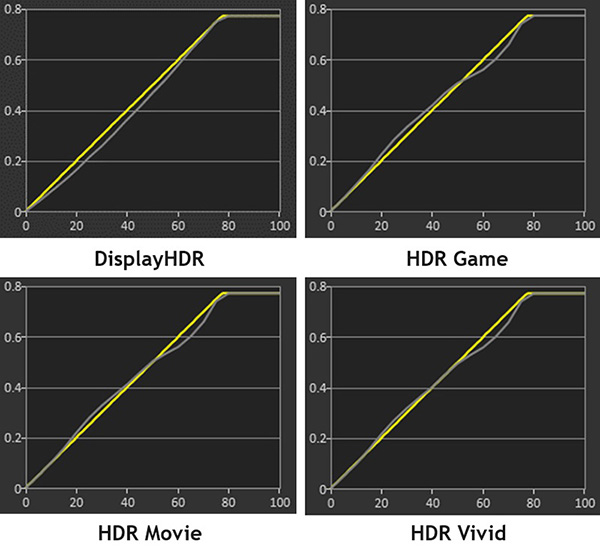
The PQ tracking in each of the HDR modes is provided above for comparison which allows you to tweak the behaviour a bit if you want. The other modes allow you to brighten the darker shades a bit more, but there is an impact to mid/light grey shades instead.
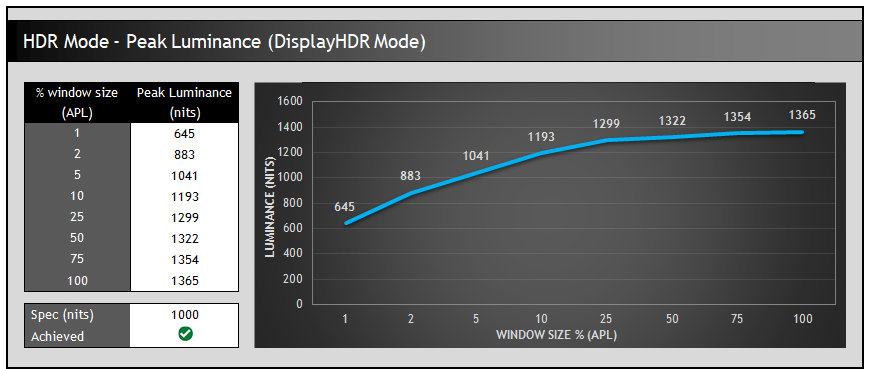
Peak brightness was strong thanks to the Mini LED backlight, reaching up to a maximum of 1365 nits which was a considerable way beyond the advertised 1000 nits in fact. It’s close to reaching the VESA DisplayHDR 1400 tier. Brightness was lower for smaller highlight areas like in the 1% APL window size, and this is because it has to try and avoid blooming and halos around smaller areas of the image. This is typical for a Mini LED backlight. The brightness was impressive on this screen though.
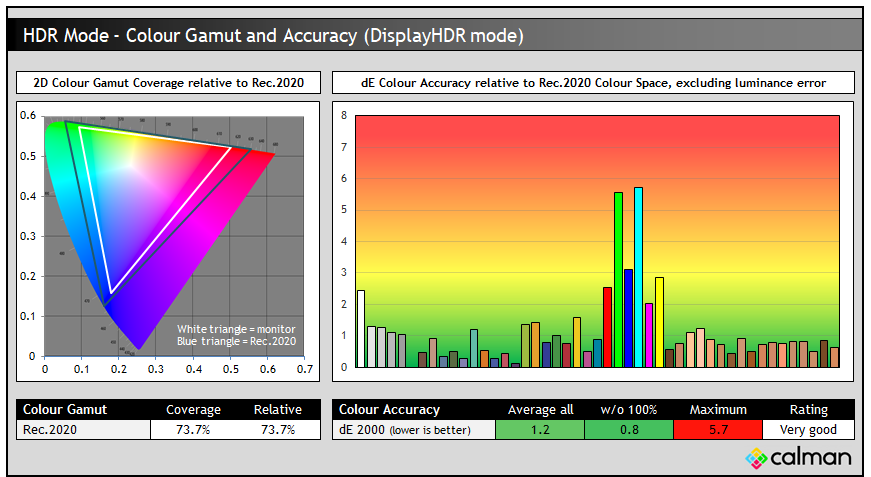
Also impressive was the colour accuracy in HDR mode. The screen offers a moderate coverage of the very wide Rec.2020 colour space, with some Quantum Dot coated monitors being able to produce more of that colour space. Apart from the 100% shades like red, green and blue in Rec.2020 (which the panel can’t reach fully) the colour accuracy was excellent, with a dE average of only 0.8. This should give you a nice accurate setup for HDR content with reliable colours.
Conclusion
Section updated Sept 2024
The Q27G3XMN represents a step change in affordable, mainstream Mini LED monitors, being extremely competitively priced while still offering some very solid performance. The screen retails for ~$260 – 280 USD at the time of writing, and is available from Amazon and Newegg. This helps finally brings decent top-end HDR capabilities to this segment without breaking the bank, along with a few other screens we’ve seen in recent times.
A few things have been cut back to support this price point, so it doesn’t have all the bells and whistles you might find on some competing screens. There’s no USB type-C connection, KVM support, PiP/PbP modes, HDMI 2.1, RGB lighting, integrated speakers or even any USB ports here. It’s fairly no frills in connectivity and added features, although thankfully the stand is fully adjustable and provides good ergonomic flexibility. From a performance point of view though it does very well in most areas.
HDR gaming and movies is obviously a key use-case for this screen and it performs really well in HDR mode. There’s a nice accurate setup, good colour accuracy, very high peak brightness and the Mini LED backlight does a great job of increasing dynamic range and contrast. The VA technology panel really helps reduce visible halos and blooming you might see on IPS equivalent screens, especially when viewing angles are thrown in to the mix. With its high native contrast ratio and avoidance of off-angle glow, we think this is a more suited LCD technology to Mini LED than IPS if it’s done right as it is here.
Default setup and accuracy was decent overall, and the final retail stock includes an accurate sRGB emulation mode with decent colour space clamping and accuracy. The ability to use the Mini LED local dimming for SDR content to improve contrast for games and movies was very welcome.
Gaming performance was also good overall. There’s a mid-tier refresh rate of 180Hz which offers decent motion clarity, a single overdrive mode experience for VRR situations and low input lag too. There is a bit of familiar VA black smearing on moving content, but it’s at quite low levels here compared with many VA panels on the market thankfully. This screen isn’t really aimed at super-fast, competitive gaming, but it handles mid-speed requirements very nicely, especially where HDR is also supported.
| Where to Buy |
| — |
All in all the Q27G3XMN does really well considering it’s attractive price point and we do hope this helps pave the way for more high-end Mini LED backlights in mainstream displays. Let’s get rid of all those crappy edge-lit and fake, no-local-dimming-at-all “HDR” monitors, and offer buyers proper HDR capabilities that a Full Array Local Dimming backlight can offer. You can check out availability and pricing for the Q27G3XMN in your region using our affiliate links above.

| Pros | Cons |
| Mini LED backlight provides high-end HDR performance without the hefty price tag | Low frills in terms of connectivity and added features to help keep the price down |
| Nice accurate HDR setup, high peak brightness and very low levels of blooming | OSD menu and navigation a bit of a pain |
| Good overall gaming performance and experience |
We may earn a commission if you purchase from our affiliate links in this article- TFTCentral is a participant in the Amazon Services LLC Associates Programme, an affiliate advertising programme designed to provide a means for sites to earn advertising fees by advertising and linking to Amazon.com, Amazon.co.uk, Amazon.de, Amazon.ca and other Amazon stores worldwide. We also participate in a similar scheme for Overclockers.co.uk, Newegg, Bestbuy , B&H and some manufacturers.