OLED and QD-OLED Image Retention and Burn-in Longevity Testing at Rtings.com – Our Thoughts and Analysis
Introduction
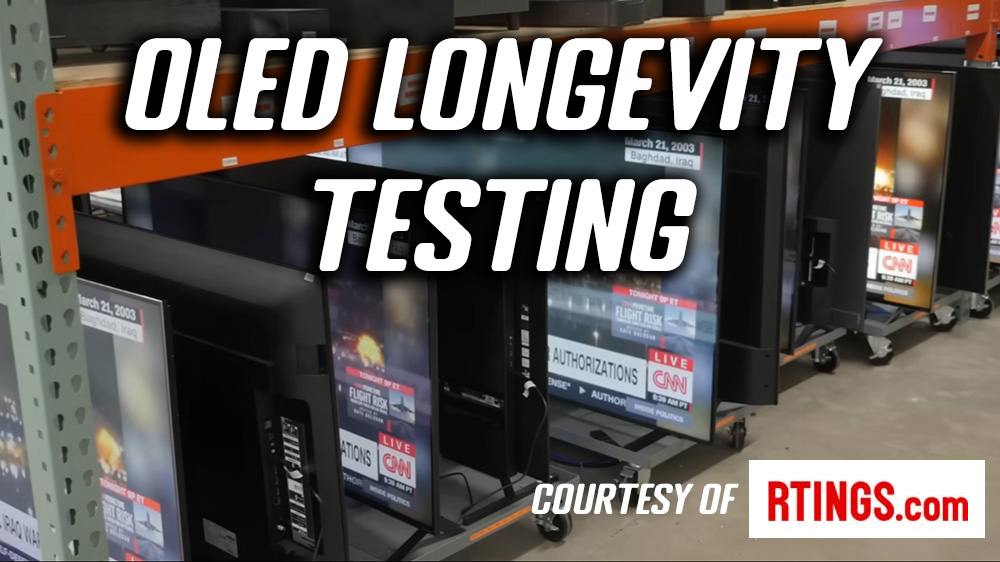
We’ve had a lot of questions about this in recent weeks and have seen lots of discussion online too, after Rtings.com released their first set of results from their excellent and thorough longevity testing of over 100 TV’s. Of particular interest were the initial results and analysis on OLED display image retention and burn-in, including comparisons between different brands (e.g. LG vs Sony) and between WOLED and QD-OLED technology. We wanted to provide a summary of our thoughts and analysis of this testing given there is a lot of discussion online about it, and we will update this article as rtings.com publish further updates and details. We have also reached out to rtings.com to share our thoughts and ideas, and some things which we would love to see checked and tested to give a fuller picture of performance.
What we want to try and avoid is people jumping to conclusions that may or may not be accurate at this stage, until there is a clearer view of all variables and possible testing differences. We will explain our thoughts below. In no way are we knocking the work done by rtings here, it’s brilliant. But the danger is that people see a headline or a single result and draw wild conclusions. We even saw LG.Display do that at a press event before rtings.com had even released their main analysis and commentary, and without even reaching out to rtings.com for discussion. That kind of thing doesn’t help.
You can find the data and test results on rtings.com here, their 3 month commentary here, as well as their summary video here on their YouTube channel. We would encourage you to look through those for more information, as we will only be providing a high level view and our commentary on the topic here.
Testing approach overview
To give a quick summary of the testing approach rtings.com have documented for the TV longevity testing:
- Tested over 100 TV’s from over the last 2 – 3 year period
- It’s a 2 year long longevity test they plan to run which would simulate 10 years’ worth of normal usage time
- The results published so far are after the first 4 months, which simulates around 1 years’ worth of normal usage time they say – the maths doesn’t quite add up here in the 2 years testing = 10 years real, but this is what they’ve said.
- Each TV will be run for a total of 126.5 hours per week
- All 100 TVs are displaying the exact same content which is a live stream of the U.S. version of CNN, untouched, with all commercials and breaks intact.
- Each TV is turned off 8 times per day to simulate possible typical on/off cycling for normal use
- During the off times, OLED screens have chance to run some of their refresh cycles
- Measurements of uniformity and brightness are taken every 2 months
- Testing started properly on 16 November 2022 and are ongoing
More details of the exact setup can be found on rtings.com here. One caveat is that they are only running with 1 sample of each screen, so outliers may exist with some samples – for instance if one screen fails, that doesn’t necessarily mean all samples of that screen would have the same problem. As rtings put it “Even if a certain TV breaks in our tests, that doesn’t mean that that’ll be your experience with that TV. Conversely, even if a TV doesn’t break in our test, it doesn’t mean that yours won’t.”
Aims of the testing
The ultimate aim of the testing is to see what changes there are to image retention/burn-in, brightness or outright component failures over time. Of particular interest here are the OLED technology panels, with rtings.com hoping to be able to draw conclusions about WOLED vs QD-OLED, whether different models are better than others and whether heat sinks or other measures can help avoid image retention or mitigate it.
Some important notes about testing methodology to be aware of
These will be important later when we consider the initial results, but rtings.com state the following in their testing methodology:
- For the duration of this test, each TV will be set up according to their recommended pre-calibration settings for that model, but with the brightness at max
- For the OLED TVs in this test, they will enable all panel-saving features, including pixel shift features and additional burn-in prevention mechanisms, like LG’s logo luminance adjustment feature.
This testing does NOT represent normal use – but can still give some useful insight
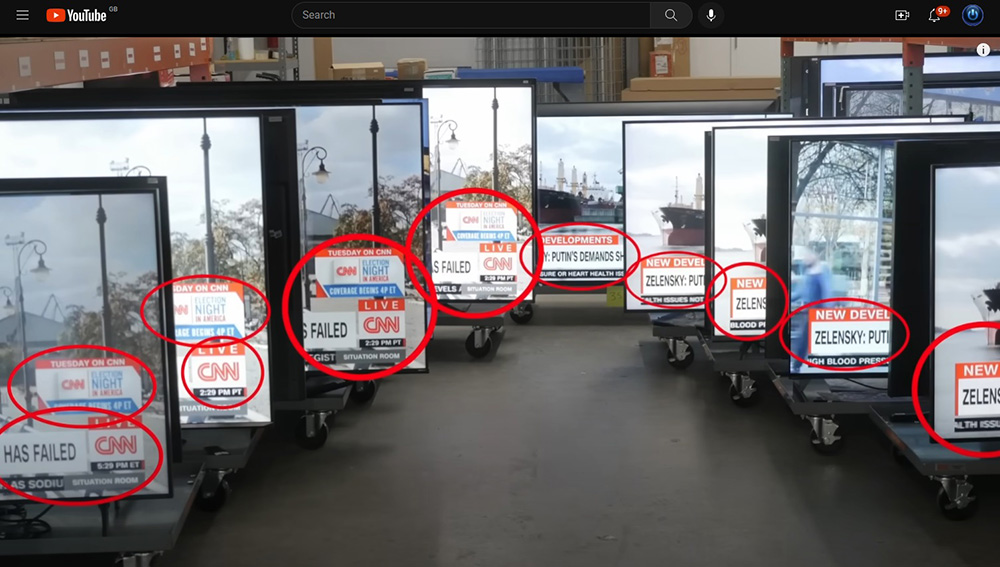
This bit is really important to remember! As rtings say themselves “It’s also important to remember that this test is meant to be an accelerated torture test; it doesn’t represent normal daily usage” – this is one of the critical considerations for this testing. This is a very extreme testing approach and is unlikely to represent any real-world usage for people who actually buy and use these screens. The CNN news feed they’ve chosen to use has many bright static elements and this is one of the reasons it was chosen. In real life if you’re using your screen for dynamic content, in the way it was really designed to be used, then these issues are significantly reduced or possibly completely eliminated. Gaming, movies, normal varied TV should not show these same problems, or certainly not anywhere near the extent of this extreme test would produce.
The results are of course still useful and interesting as we can hopefully draw some insight and conclusions from them. For instance, is there a increased risk if you are prone to using a lot of static content? Could it give some indication that PC and desktop usage is a bigger risk where static elements are common? Are you going to need to be a bit more careful on certain OLED technologies compared with others? Could it provide some insight around static elements even in dynamic content like TV logos or gaming HUD’s perhaps? Can it tell us anything about the different OLED technologies, or the different protection measures employed by different manufacturers?

This is all about understanding if there is more or less concern with different variables, but we need to keep in mind that the testing is not representative of normal usage, and so all of this may even be totally irrelevant to you as a user or buyer of OLED screens, if you know your content and usage patterns will be dynamic, and not anything like the test setup they’ve used. Do not let these results put you off considering an OLED screen if your usage is going to be drastically different to the stress test.
One other thing to also keep in mind is that it’s accelerating 10 years’ worth of usage into a 2 year test. So while image retention may appear after 4 months in their test potentially, that represents 1 year of normal usage time rtings say. What if image retention occurs after 20 months (equal to 5 years of normal usage time)? At what point would you be changing your TV anyway? Some people may be changing their screen much sooner than a 10 year window, although of course you still want to be able to understand if it could last you 10 years or longer. Just think about what the testing time window really translates in to for real usage time. 4 months of their testing is not 4 months of your real usage time.
The initial findings and assumptions being made
Rtings published their commentary and analysis after the first 3 months of testing here, leading to various conclusions being drawn on discussion forums and elsewhere:
Sony WOLED TV’s show higher image retention than LG WOLED?
The first headline that people are drawing conclusions on is that LG OLED TV’s seem to fare better than Sony OLED TV’s, despite both using the same LG.Display WOLED panel technology. The images provided by rtings show that, for example, the Sony A90K showed “possible permanent image retention after 2 months”, where the LG C2 was “showing no image retention”. Does that mean LG OLED’s are better than Sony in this regard and have less burn-in risk?

For the Sony TV’s they also attempted to clear the image retention and establish if it could be cleaned, or if it was permanent burn-in:
- An image cleaning video was run for “about a week” following the regular stress test schedule
- They were able to “nearly eliminate all image retention” on some Sony screens – the A8H, A80K and A90J
- The Sony A80J and A90K however looked no better, suggesting permanent burn-in instead of image retention. The cleaning video even made things worse on the A90K, leaving its own image retention too!
- (LG OLED models didn’t seem to show any image retention during the same 3 month testing period)
While the OLED layer is the same between LG and Sony screens, rtings report that most other components and electronics appear to be different, and of course software and firmware varies too. One fundamental operational difference between the Sony and LG screens which rtings commented on was their compensation cycles – the panel and pixel cleaning mechanisms designed to help mitigate image retention risks. During that initial 3 month testing window, Sony screens only ran their cycles once the TV has been turned off for >4 hours, while LG screens run their cycles straight away each time it was turned off. During the initial testing window (~3 months) this meant that Sony screens were only getting to run 3 compensation cycles per week, while the LG’s were running 21. Initially this was suggested as a possible cause of the increased image retention, and so a couple of new screens were added in to the mix to experiment.
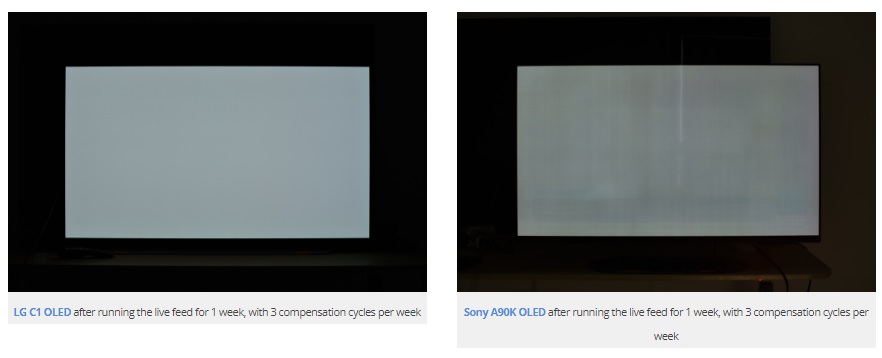
Both new screens were set to only allow 3 compensation cycles to run per week. After that shorter 1 week test, a second Sony A90K showed image retention still (as reported here), while a newly added LG 48C1 showed none! As far as we can tell, this is also with the also LG being on for a longer total period than the Sony. Rtings say that the LG was on for 23 hours per day, with 1 hour off on 3 days of the week to allow the compensation cycle to run 3 times, and on the other days it was on for the full 24 hours (165 total hours on). While the Sony followed the normal stress test schedule which is 126.5 hours for the week (20hr per day on Tue, Thur, Sat and Sun; and 15.5 hours per day Mon, Wed, Fri). Both were able to run 3 compensation cycles during the week, but even though the LG was on for longer in total, it showed less image retention.
So based on this initial limited test period, it seems it might not be related to the compensation cycles. We would like to see more testing over a longer period where the compensation cycle runs are uniform though before we are sure it’s not this causing the difference.
Variables and questions we need answering before we can really draw conclusions
Before everyone jumps to conclusions and labels Sony screens as worse than LG, we have some open questions that need testing and verifying. We’ve reached out to rtings to suggest the same:
Using maximum brightness is possibly an unfair comparison
As we mentioned earlier (we said this was going to be important), all screens were run at “their maximum brightness”. Could variances between actual screen SDR brightness capabilities be causing this additional image retention? Is this being caused by different panels that are simply capable of higher SDR brightness than others? Are LG screens more conservative with their brightness as a measure to help reduce this risk? Is it fair to compare image retention for two screens that could be operating with different actual luminance levels? This feels like one of the biggest potential variables that need to be checked and eliminated and could fundamentally be impacting the results.
One way to test this would be to set both screens to the same luminance (which may be at different brightness settings on each screen), and perhaps also something more sensible and common than “max brightness” as well to simulate normal usage. If this test is designed to short cut 10 years’ worth of normal usage, running at a typical 150 or 200 nits luminance might be more suitable. With both screens running at the same brightness level, how does the image retention then compare?
How the two screens handle ABL dimming as the image changes could be another potential factor but for a start, running at a calibrated comparable brightness level on all screens would be well worth doing.
Are other mitigation measures responsible?
The testing methodology tells us that they have “enable(d) all panel-saving features, including pixel shift features and additional burn-in prevention mechanisms, like LG’s logo luminance adjustment feature.” Although further results and testing would probably be needed, the early signs are that the panel cleaning cycles are likely not the cause of the difference here. Could it be one of the other protection measures though?
Sony and LG TV’s both have pixel shifter features so those should be similar or the same, but it would be interesting to eliminate this variable by turning them off on both. However, only the LG models have logo dimming – given that is designed to dim static areas and screen logos, it seems like that could be exactly the kind of thing that could help reduce the risk on the LG screens and avoid the burn-in. Is the burn-in more comparable between the two screens if you turn this feature off on the LG? (note you would probably also have to disable the GSR option in the service menu for fully switching off logo dimming). It would be interesting to see if that is adding a lot of value on the LG screens. If so, would that be one of the key things you’d want to leave on if you’re worried about static elements if you can?

Are there any other image retention features that vary between the two. We know LG screens have a pretty aggressive ASBL (Automatic Static Brightness Limiter) that detects static or unchanging images and dims the brightness until a more drastic content change happens. Does the Sony have the same and do they operate in the same way? Is that happening at all during this testing on either screen? Or is one dimming more often than the other? Given the content is fairly static by design, that could possibly be happening more on the LG than the Sony, leading to less image retention. If this is playing its part, again does that suggest it has a value?
Finally are there any differences between the two when it comes to heat dissipation, heat sinks, air vents etc? That could help reduce image retention on a screen that runs cooler or is better at dissipating heat.
Of course, if any of these are responsible for the difference, that’s still a sign that one may be better than the other because of it – but right now we don’t have clarity on why the Sony screens appear to show more image retention than LG OLED’s.
A different refresh rate video could help identify if it’s short-term image retention or permanent burn-in
A side note. Rtings say that their pixel refresh video used to try and clear image retention alternates so quickly between different colours images that it didn’t give the ABL chance to kick in, resulting in the screens heating up significantly. As a result they resorted to lowering the screen brightness to run this cleaning video. Would a different cleaning video, perhaps one representative of real-world content, allow them to run at max brightness as they had during the actual CNN stress test, and improve the cleaning capabilities and cleaning results? Does lowering the brightness for this cleaning video cause it to have less effect on the burn-in?
QD-OLED is worse than WOLED for image retention?
The second and most commonly discussed headline seems to be that Samsung’s QD-OLED panel tech is for some reason worse than LG.Display’s WOLED for image retention, but we need to break this down further. Rtings say that “after two months, the two QD-OLED displays on this test (Samsung S95B OLED and the Sony A95K) are both showing signs of possible permanent image retention (burn-in), but the LG WOLED TVs like the LG C2 OLED and the LG G2 OLED are clean.” Does this cause concern for fans of QD-OLED TV’s? What about in the monitor space where QD-OLED has been around a bit longer than WOLED and used in quite a few early OLED monitors so far, like the Dell Alienware AW3423DW / DWF and Samsung Odyssey OLED G8?
Is it because of the white sub-pixel?
Before Rtings had even published their analysis and commentary, this theory was being promoted by LG.Display. They (perhaps unsurprisingly) jumped on the test images that were published a little earlier than the analysis by rtings and held a press briefing claiming that QD-OLED was worse, and the reason was that LG’s WOLED panels have an extra white sub-pixel (hence the “W” in WOLED). The theory goes that when an LG WOLED panel needs to show white, it can make use of that extra white sub-pixel nicely, but when a Samsung QD-OLED need to show white, all 3 of their RGB sub-pixels need to light up, putting additional stress on the panel and causing more risk of image retention.

This white sub-pixel is actually something often cited as a problem, causing text rendering problems in Windows as it’s an unusual sub-pixel layout (BWGR). Call us cynical, but it seemed like LG.Display were pretty quick to turn this “negative” in to a “positive” and claim that actually all along, this extra white sub-pixel was a good thing.
Now we’re not saying that this definitely isn’t the reason for the differences, it could well be. The theory sounds plausible and logical. But at the moment we don’t think we have sufficient information to know for sure, or to claim that this is definitely the reason. There’s other variables at play that could equally be causing the difference. It may actually be nothing to do with the white sub-pixel, we can’t be sure yet. Just because LG.Display say it’s that, doesn’t fill us with confidence to be honest.
- Rtings have so far concluded that it is not being caused by image retention compensation cycles
- The Samsung QD-OLED and LG WOLED panels ran the same 21 cycles per week and the Samsung looked worse
- And although the Sony QD-OLED ran only 3 cycles, that actually looked better than the Samsung QD-OLED despite far fewer compensation cycles
Variables and questions we need answering before we can really draw conclusions
Before everyone jumps to conclusions and says QD-OLED is worse than WOLED, or that it’s definitely because of the extra white sub-pixel on WOLED, we have some open questions that need testing and verifying. We’ve reached out to rtings to suggest the same. We won’t repeat everything we said earlier, so please read these points above for more detail and context:
- Using maximum brightness is probably an unfair comparison – like the Sony vs LG debate, screen luminance could be potential difference maker. This variable needs to be consistent as it could easily be causing the difference, especially as (in the monitor space at least) QD-OLED tends to be able to reach higher brightness than LG WOLED. Are LG’s panels simply more conservative to reduce the risk? This needs to be eliminated as a possible variable and cause.
- Are other mitigation measures responsible? – as before, is the difference actually being caused by something completely different like logo dimming on LG screens, better heat dissipation or more active ASBL dimming? We can’t conclude that it’s the white sub-pixel ncessarily that is making the difference until other variables have been tested and eliminated.
What does this mean for OLED monitors?

It’s worth re-iterating the point from earlier – this testing is unrealistic stress testing and does not represent real-world usage for any normal user. It’s using these screens for many more hours a week than an average user, on images that have deliberate static elements and are designed to cause these problems. But if you’re using the screen for varied dynamic content, for gaming, videos, movies etc then you probably don’t need to worry about any of this at all. A normal usage will be significantly different to the testing scenario here.
For anyone considering an OLED display, you of course need to be mindful of image retention risks – this testing does at least show that it’s still a concern and a potential problem for this technology if you push it. But as long as you’re careful, vary your content, consider your usage type and use the provided mitigation measures too; then you should not come across anywhere near this level of problem, if any at all.
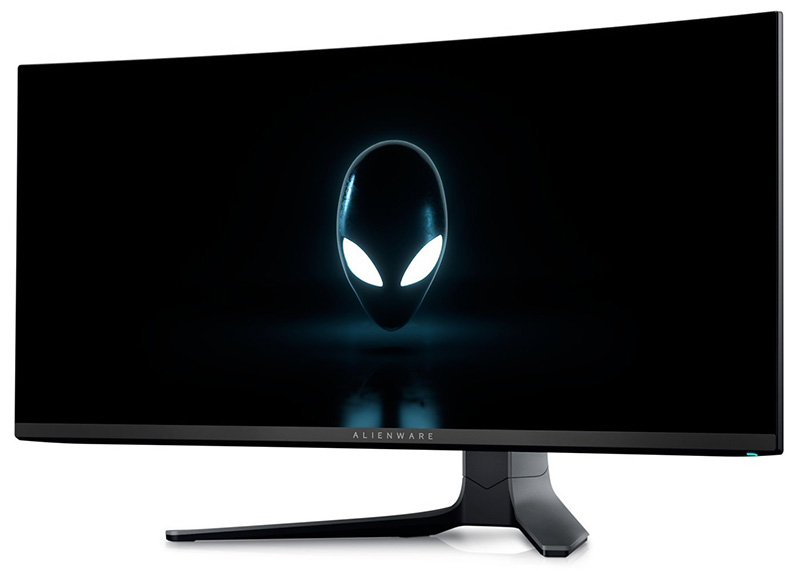
Rtings are adding some QD-OLED monitors to their longevity tests now as well like the Dell Alienware AW3423DWF and Samsung Odyssey OLED G8 so that will also provide some additional interesting data.
Other related content: OLED Monitor Panel development plans and roadmap for the future
We will update this article in the future as more results and details are released. Keep an eye on rtings.com for more updates and news too!
Further Reading
- Rtings testing methodology and longevity test explanation
- Rtings 3 month analysis and commentary
- Stay up to date on the testing at rtings.com here
- Rtings summary video of results so far after 4 months
- Our article: OLED Dimming Confusion – APL, ABL, ASBL, TPC and GSR Explained
- Our video: Before You Buy an OLED Monitor – 5 Things You Need to Know
- Our article: OLED Monitor Panel development plans and roadmap for the future
We may earn a commission if you purchase from our affiliate links in this article- TFTCentral is a participant in the Amazon Services LLC Associates Programme, an affiliate advertising programme designed to provide a means for sites to earn advertising fees by advertising and linking to Amazon.com, Amazon.co.uk, Amazon.de, Amazon.ca and other Amazon stores worldwide. We also participate in a similar scheme for Overclockers.co.uk, Newegg, Bestbuy , B&H and some manufacturers.
Stay Up To Date
 |  |  |  |
| Browser Alerts | Follow on X | Subscribe on YouTube | Support Us |
Popular Trending Articles
 More Glossy WOLED Monitors! Gigabyte Launch Two New Models, With More to Come January 23, 2026 Looking at the newly announced ‘RealBlack Glossy’ monitors from Gigabyte, expanding the choice of glossy WOLED monitors in the market. We compare matte vs glossy pros and cons, and break down the new monitors
 Here’s Why You Should Only Enable HDR Mode on Your PC When You Are Viewing HDR Content May 31, 2023 Looking at a common area of confusion and the problems with SDR, desktop and normal content when running in HDR mode all the time
![[Round-up] All the Latest Awesome 2026 Monitors from MSI at CES 2026 msi ces 2026 website featured](https://tftcentral.co.uk/wp-content/uploads/2026/01/msi-ces-2026-website-featured-130x90.jpg) [Round-up] All the Latest Awesome 2026 Monitors from MSI at CES 2026 January 8, 2026 All our coverage from CES 2026 for MSI’s exciting new 2026 monitors, including new 34″ QD-OLED, 5K dual-mode, Mini LED and G-sync Pulsar
[Round-up] All the Latest Awesome 2026 Monitors from MSI at CES 2026 January 8, 2026 All our coverage from CES 2026 for MSI’s exciting new 2026 monitors, including new 34″ QD-OLED, 5K dual-mode, Mini LED and G-sync Pulsar Gen 4 Samsung QD-OLED 2025 Panels and Improvements April 14, 2025 A complete look at Samsung Display’s latest QD-OLED updates and news for 2025 including new technologies, improvements and specs
 QD-OLED Generations Infographic and FAQ June 17, 2025 A handy infographic explaining all QD-OLED panel generations along with answers to frequently asked questions
