Specs
LCD and TFT Classification
LCD stands for “Liquid Crystal Display” and TFT stands for “Thin Film Transistor”. These two terms are used commonly in the industry but refer to the same technology and are really interchangeable when talking about certain technology screens. The TFT terminology is often used more when describing desktop displays, whereas LCD is more commonly used when describing TV sets. Don’t be confused by the different names as ultimately they are one and the same. You may also see reference to “LED displays” but the term is used incorrectly in many cases. The LED name refers only to the backlight technology used, which ultimately still sits behind an liquid crystal panel (LCD/TFT).
Screen Size
As TFT screens are measured differently to older CRT monitors, the quoted screen size is actually the full viewable size of the screen. This is measured diagonally from corner to corner. TFT displays are available in a wide range of sizes and aspect ratios now. More information about the common sizes of TFT screens available can be seen in our section about resolution.
Aspect Ratio
The aspect ratio of a TFT describes the ratio of the image in terms of its size. The aspect ratio can be determined by considering the ratio between horizontal and vertical resolution.
- 4:3 = For instance a 20″ screen with 1600 x 1200 resolution
- 5:4 = for instance a 17″ or 19″ models with 1280 x 1024 resolution
- 16:10 = wide screen formats such as 1920 x 1200 and 2560 x 1600
- 16:9 = wide screen formats such as 1920 x 1080 and 2560 x 1440. 16:9 is commonly used for multimedia displays and TV’s and is increasingly becoming the standard
- 21:9 Ultra Wide = offering for example 3440 x 1440 and 2560 x 1080 resolutions
- Ultra-high resolution panels will offer varying aspect ratios including Ultra HD (3840 x 2160 = 16:9), 4K (4096 x 2160 = an odd 1:9:1 aspect ratio) and 5K (5120 x 2880 = 16:9)
Resolution
The resolution of a TFT is an important thing to consider. All TFT’s have a certain number of pixels making up their liquid crystal matrix, and so each TFT has a “native resolution” which matches this number. It is always advisable to run the TFT at its native resolution as this is what it is designed to run at and the image does not need to be stretched or interpolated across the pixels. This helps keep the image at its most clear and at optimum sharpness. Some screens are better than others at running below the native resolution and interpolating the image which can sometimes be useful in games.
You generally cannot run a TFT at a resolution of above its native resolution although some screens have started to offer “Virtual” resolutions, for example “virtual 4k” where the screen will accept a 3840 x 2160 input from your graphics card but scale it back to match the native resolution of the panel which is often 2560 x 1440 in these examples. This whole process is rather pointless though as you lose a massive amount of image quality in doing so.
Make sure your graphics card can support the desired resolution of the screen you are choosing, and based on your uses. If you are a gamer, you may want to consider whether your graphics card can support the resolution and refresh rate you will want to use to power your screen. Also keep in mind whether you are planning to connect external devices and the resolution they are designed to run at. For instance if you have a 16:10 format screen and plan to use an external device which runs at 16:9, you will need to ensure the screen is able to scale the image properly and add black borders, instead of distorting the aspect ratio of the image.
Ultra-high resolutions must be thought of in a slightly different way. Ultra HD (3840 x 2160) and 4K (4096 x 2160) resolutions are being provided nowadays on standard screen sizes like 24 – 27” for instance. Traditionally as you increased the resolution of panels it was about providing more desktop real estate to work with. However, with those resolutions being so high, and the screen size being relatively small still, the image and text becomes incredibly small if you run the screen at normal scaling at those native resolutions. For instance imagine a 3840 x 2160 resolution on a 24” screen compared with 1920 x 1080. The latter would probably be considered a comfortable font size for most users. These ultra-high resolutions nowadays are about improving image clarity and sharpness, and providing a higher pixel density (measured as pixels per inch = PPI). In doing so, you can improve the sharpness and clarity of an image much like Apple have famously done with their “Retina” displays on iPads and iPhones. To avoid complications with tiny images and fonts, you will then need to enable scaling in your operating system to make everything easier to see. For instance if you enabled scaling at 150% on a 3840 x 2160 resolution, you would end up with a screen real estate equivalent to a 2560 x 1440 panel (3840 / 1.5 = 2560 and 2160 / 1.5 = 1440). This makes text much easier to read and the whole image a more comfortable size, but you then get additional benefits from the higher pixel density instead, which results in a sharper and crisper image.
Generally you will need to take scaling in to consideration when purchasing any ultra-high resolution screen, unless it’s of a very large size. The scaling ability does vary however between different operating systems so be careful. Apple OS and modern Windows (8 and 10) are generally very good at handling scaling for ultra-high res displays. Older operating systems are less capable and may sometimes be complicated. You will also find varying support from different applications and games, and often end up with weird sized fonts or sections that are not scaled up and remain extremely small. A “standard” resolution where you don’t need to worry about scaling might be simpler for most users.
As a guide to some common resolutions available:
| Screen Size (diagonal inches) | Common Resolution | Other Resolutions Commonly Available (different aspect ratio) |
| 15 | 1024 x 768 | – |
| 17 | 1280 x 1024 | – |
| 17 WS | 1280 x 768 | – |
| 18 | 1280 x 1024 | – |
| 18.5 WS | 1366 x 768 | – |
| 19 | 1280 x 1024 | – |
| 19 WS | 1440 x 900 | 1366 x 768, 1680x 1050 |
| 20 | 1600 x 1200 | 1400 x 1050 |
| 20 WS | 1680 x 1050 | 1600 x 900 |
| 21 | 1600 x 1200 | 2048 x 1536 |
| 21 WS | 1680 x 1050 | – |
| 21.5 WS | 1920 x 1080 | – |
| 21.6 WS | 1920 x 1080 | – |
| 22 WS | 1680 x 1050 | 1920 x 1200 |
| 23 WS | 1920 x 1200 | 2048 x 1152 |
| 23.1 WS | 1600 x 1200 | |
| 23.6 WS | 1920 x 1080 | |
| 24 WS | 1920 x 1200 | 1920 x 1080 |
| 25 WS | 1920 x 1080 | – |
| 26 WS | 1920 x 1200 | – |
| 27 WS | 2560 x 1440 | 1920 x 1080, 2048 x 1152, 1920 x 1200 |
| 28 WS | 1920 x 1200 | – |
| 29 WS | 2560 x 1080 | |
| 30 WS | 2560 x 1600 | – |
| 34 WS | 3440 x 1440 | 2560 x 1080 |
| 35 WS | 2560 x 1080 |
High Definition Resolution Support

More and more you will see resolutions referred to by their common HD equivalents, particularly when it comes to TV’s. HD content is based purely on the resolution of the source and is commonly defined by the number of pixels vertically in the resolution. i.e. a 720 HD source has 720 vertical pixels in it’s resolution and a 1080 will have 1080. On top of this, there are two ways of showing this content, either using a progressive scan (e.g. 1080p) or an interlaced scan (1080i).
To display this content of this type, your screen needs to be able to 1) handle the full resolution naturally within its native resolution, and 2) be able to handle either the progressive scan or interlaced signal over whatever video interface you are using. If the screen cannot support the full resolution, the image can still be shown but it will be scaled down by the hardware and you won’t be take full advantage of the high resolution content. So for a monitor, if you want to watch 1080 HD content you will need a monitor which can support at least a vertical resolution of 1080 pixels, e.g. a 1920 x 1080 monitor.
Ultra HD, 4K and 5K
In today’s monitor market resolutions are being pushed even higher and we need to start thinking about them in a different way. See the subsequent sections on pixel pitch and PPI for more information on how we should think about resolution now.
This has given rise to modern Ultra HD standards and terms like 4K and 5K. Ultra HD is a term for monitors with a 3840 x 2160 resolution, that being four times the resolution of Full HD 1920 x 1080. Screens with this Ultra HD resolution are often referred to as “4K” as well, although strictly that should only be used for screens with 4092 x 2160 resolution (4K representing the vertical resolution here). There are also some 5K capable monitors produced which offer 5120 x 2880 resolution (5K here representing the vertical resolution). Please see the following sections which talk about Pixel Pitch and PPI and will help you understand these higher resolutions in more detail.
Pixel Pitch
![]()
Unlike on CRT’s where the dot pitch is related to the sharpness of the image, the pixel pitch of a TFT is related to the distance between pixels. This value is fixed and is determined by the size of the screen and the native resolution (number of pixels) offered by the panel. Pixel pitch is normally listed in the manufacturers specification. Generally you need to consider that the ‘tighter’ the pixel pitch, the smaller the text will be, and potentially the sharper the image will be. To be honest, monitors are normally produced with a sensible resolution for their size and so even the largest pixel pitches return a sharp images and a reasonable text size. Some people do still prefer the larger-resolution-crammed-into-smaller-screen option though, giving a smaller pixel pitch and smaller text. It’s down to choice and ultimately eye-sight.
For instance you might see a 35″ ultra-wide screen with only a 2560 x 1080 resolution which would have a 0.3200 mm pixel pitch. Compare this to a 25″ screen with 2560 x 1400 resolution and 0.2162 mm pixel pitch and you can see there will be a significant different in font size and image sharpness. There are further considerations when it comes to the pixel pitch of ultra-high resolution displays like Ultra HD and 4K. See the section on PPI for more information.
To calculate the pixel pitch of a given monitor size and resolution, you can use this useful pixel pitch calculator
PPI (Pixels Per Inch)
Resolution is typically thought as a factor which determines the screen area or screen “real estate” you will have available. In years gone by as panel sizes increased, resolutions were increased as well and so bigger screens could offer you more desktop space to work with. Split-screen working and high resolution image work become more and more possible. This is fine up to a point, but pushing resolution for the purposes of delivering more desktop real-estate reaches a point where it becomes somewhat impractical for desktop monitors. For instance, a 40″ 3840 x 2160 resolution delivers a comfortable pixel pitch and font size natively (very similar to a 27″ at 2560 x 1440), so if you wanted a higher resolution than this you would have to increase the screen size again probably. You start to reach the point where sitting close to a screen so large becomes impractical.
Instead manufacturers are now focusing on delivering higher resolutions in to existing panel sizes, not for the purpose of providing more desktop real-estate, but for the purpose of improving image sharpness and picture quality. Apple started this trend with their “Retina Displays” used in iPads and iPhones, improving image sharpness and clarity massively. It is common now to see smaller screens such as 24″ and 27″ for instance, but with high resolutions like 3840 x 2160 (Ultra HD) or even 5120 x 2880 (5K). By packing more pixels in to the same screen size which would typically offer a 2560 x 1440 resolution, panel manufacturers are able to provide much smaller pixel pitches and improve picture sharpness and clarity. To measure this new way of looking at resolution you will commonly see the spec of ‘Pixels Per Inch’ (PPI) being used.
Of course the problem with this is that if you run a screen as small as 27″ with a 5K resolution, the font size is absolutely tiny by default. You get a massive boost of desktop real-estate, just like when moving from 1920 x 1080 to 2560 x 1440, but that’s not the purpose of these higher resolutions now. To overcome this you need to use the scaling options in your Operating System software to scale the image and make it more usable. Windows provides for instance scaling options like 125% and 150% within the control panel. On a 3840 x 2160 Ultra HD resolution if you use a 150% scaling option for example you will in effect reduce the desktop area by a third, resulting in the same desktop area as a 2560 x 1440 display (i.e. 2560 x 150% = 3840). The OS scaling makes font sizes more comfortable and reasonable, but you maintain the sharp picture quality and small pixel pitch of the higher resolution panel. A 3840 x 2160 res panel scaled at 150% in Windows will look sharper and crisper than a 2560 x 1440 native panel without scaling, despite the fact both would have the same effective desktop area available.
Scaling via your OS is not the same as scaling from your monitor. If you just simply ran the screen at a lower resolution like 2560 x 1440 within the resolution section of your graphics card, the image gets interpolated by the monitor scaler instead. You get the same end result of a 2560 x 1440 sized desktop area size, but the image clarity is lost and you lose a lot of sharpness. The monitor is doing the interpolation for you here. Instead you run the screen at the full 3840 x 2160 resolution in the graphics card settings and allow the OS scaling control to increase font size and make the image useable.
How well the scaling is done really depends on your Operating System and software you are using. Some modern OS like Mac OS and Windows 7 / 8 / 10 handle scaling very well as they are designed to accommodate super high resolutions well. Older OS might struggle and you may find some odd sizing issues in some cases. Some software packages, programs and games also handle scaling in different ways, so it’s something to watch out for. Super high resolutions which require OS scaling might not be for everyone at the moment, but expect to see them become more and more the norm in the future.
Have a read of Eizo’s excellent article about the topic for further information
Panel Type

While this aspect is not always discussed by display manufacturers it is a very important area to consider when selecting a TFT monitor. The LCD panels producing the image are manufactured by many different panel vendors and most importantly, the technology of those panels varies. Different panel technologies will offer different performance characteristics which you need to be aware of. Their implementation is dependent on the panel size mostly as they vary in production costs and in target markets. The four main types of panel technology used in the desktop monitor market are:
TN film (Twisted Nematic + Film)
TN Film was the first panel technology to be widely used in the desktop monitor market and is still regularly implemented in screens of all sizes thanks to its comparatively low production costs. TN Film is generally characterized by good pixel responsiveness making it a popular choice for gamer-orientated screens. Where overdrive technologies are also applied the responsiveness is improved further. TN Film panels are also available supporting 120Hz+ refresh rates making them a popular choice for stereoscopic 3D compatible screens. While older TN Film panels were criticized for their poor black depth and contrast ratios, modern panels are actually very good in this regard, often producing a static contrast ratio of up to 1000:1. Perhaps the main limitation with TN Film technology is its restrictive viewing angles, particularly in the vertical field. While specs on paper might look promising, in reality the viewing angles are restrictive and there are noticeable contrast and gamma shifts as you change your line of sight. TN Film panels are normally based around a 6-bit colour depth as well, with a Frame Rate Control (FRC) stage added to boost the colour palette. They are often excluded from higher end screens or by colour enthusiasts due to this lower colour depth and for their viewing angle limitations. TN Film panels are regularly used in general lower end and office screens due to cost, and are very popular in gaming screens thanks to their low response times and high refresh rate support. Pretty much all of the main panel manufacturers produce TN Film panels and all are widely used (and often interchanged) by the screen manufacturers.
IPS-type (In Plane Switching)
IPS was originally introduced to try and improve on some of the drawbacks of TN Film. While initially viewing angles were improved, the panel technology was traditionally fairly poor when it came to response times and contrast ratios. Production costs were eventually reduced and the main investor in this technology has been LG.Display (formerly LG.Philips). The original IPS panels were developed into the so-called Super IPS (S-IPS) generation and started to be more widely used in mainstream displays. These were characterized by their good colour reproduction qualities, 8-bit colour depth (without the need for Frame Rate Control) and very wide viewing angles. These panels were traditionally still quite slow when it came to pixel response times however and contrast ratios were mediocre. In more recent years a change was made to the pixel alignment in these IPS panels (see our detailed panel technology article for more information) which gave rise to the so-called Horizontal-IPS (H-IPS) classification. With the introduction of overdrive technologies, response times were improved significantly, finally making IPS a viable choice for gaming. This has resulted more recently in IPS panels being often regarded as the best all-round technology and a popular choice for display manufacturers in today’s market. Improvements in energy consumption and reduced production costs lead to the generation of so-called e-IPS panels. Unlike normal 8-bit S-IPS and H-IPS classification panels, the e-IPS generation worked with a 6-bit + FRC colour depth. Developments and improvements with colour depths also gave rise to a generation of “10-bit” panels with some manufacturers inventing new names for the panels they were using, including the co-called Performance-IPS (p-IPS). It is important to understand that these different variants are ultimately very similar and the names are often interchanged by different display vendors. For more information, see our detailed panel technologies guide.
Nowadays IPS panels are produced and developed by several leading panel manufacturers. LG.Display technically own the IPS name and continue to invest in this popular technology. Samsung began production of their very similar PLS (Plane to Line Switching) technology, as did AU Optronics with their AHVA (Advanced Hyper Viewing Angle). These are all so similar in performance and features that they can be simply referred to now as “IPS-type”. Indeed monitor manufacturers will normally stick to the common IPS name but the underlying panel may be produced by any number of different manufacturers investing in this type of panel tech. AU Optronics have done a good job with finally increasing the refresh rate of their IPS panels, and making them a more viable option for gamers. Native 144Hz IPS-type panels are now available and response times continue to be reduced as well. Modern IPS panels are characterized by decent response times, if not quite as fast as TN Film they are certainly more fluid than older panels. Contrast ratios are typically around 1000:1 and viewing angles continue to be the widest and most stable of any panel technology. You will find varying colour depths including 6-bit+FRC and 8-bit commonly being used, although this makes little difference in practice. One of the remaining limitations with IPS-type technologies are the so-called “IPS glow”, where darker content introduces a pale glow when viewed from an angle. It’s a characteristic of the panel technology and pretty hard to avoid without additional filters being added to the panels. On larger and wider screens some people find this glow distracting and problematic.
VA-type (Vertical Alignment)
The original early VA panels were quickly scrapped due to their poor viewing angles, and in their place came the two main types of VA matrix. Multi-Domain Vertical Alignment (MVA) and Patterned Vertical Alignment (PVA) panels. These VA variants were characterized by their reasonably wide viewing angles, being better than TN Film but not as wide as IPS. They were originally poor when it came to pixel response times but offered 8-bit colour depths and the best static contrast ratios of all the technologies discussed here. Traditionally VA panels were capable of static contrast ratios of around 1000 – 1200:1 but this has even been improved now to 3000:1 and above. Until very recently VA panels remained very slow and so were not really suitable for gaming. However during 2012 we saw advancements with the latest generation of VA panels and through the use of overdrive technologies this has been significantly improved. Perhaps the main limitation with VA panels is still their viewing angles when compared with popular IPS panel options. Gamma and contrast shifts can be an issue and the technology also suffers from an inherent off-centre contrast shift issue which can be distracting to some users. Through the years we have seen several different generations of VA panels. AU Optronics are the main manufacturer of MVA matrices, and we have seen the so-called Premium-MVA (P-MVA) and Advanced-MVA (AMVA) generations emerge. Chi Mei Innolux (previously Chi Mei Optoelectronics / CMO) also make their own variant of MVA which they call Super-MVA (S-MVA). The only manufacturer of PVA panels is Samsung as it is their own version of VA technology. We have seen several generations from them including Super-PVA (S-PVA) and cPVA and SVA. For more information, see our detailed panel technologies guide.
Advanced Super View (ASV)
This technology was developed by Sharp for use in some of their TFT displays. It consists of several improvements that Sharp claim to have made, mainly to counter the drawbacks of the popular TN Film technology. They have introduced an Anti-Glare / Anti-Reflection (AGAR) screen coating which forms a quarter-wavelength filter. Incident light is reflected back from front and rear surfaces 180° out of phase, thus canceling reflection rather diffusing it as others do. As well as reducing glare and reflection from the screen, this is marketed as being able to offer deeper black levels. Sharp also claim to offer better contrast ratios than any competing technology (VA and IPS); but with more emphasis on improving these other technologies, this is probably not the case with more modern panels. There are very few ASV monitors around really, with the majority of the market being dominated by TN, VA and IPS panels.
Advanced Fringe Field Switching (AFFS)
This technology was developed by BOE Hydis, and is not really very widely used in the desktop TFT market, more in the mobile and tablet sectors. It is worth mentioning however in case you come across displays using this technology. It was developed by BOE Hydis to offer improved brightness and viewing angles to their display panels and claims to be able to offer a full 180/180 viewing angle field as well as improved colours. This is basically just an advancements from IPS and is still based on In Plane technology. They claim to “modify pixels” to improve response times and viewing angles thanks to improved alignment. They have also optimised the use of the electrode surface (fringe field effect), removed shadowed areas between pixels, horizontally aligned electric fields and replaced metal electrodes with transparent ones. More information about AFFS can be found here.
Super Fine TFT Technology (SFT)
This panel technology was developed by NEC LCD, and is reported to offer wide viewing angles, fast response times, high luminance, wide colour gamut and high definition resolutions. Of course, there is a lot of marketing speak in there, and the technology is not widely employed in the mainstream monitor market. Wide viewing angles are possible thanks to the horizontal alignment of liquid crystals when electrically charged. This alignment also helps keep response times low, particularly in grey to grey transitions. Their SFT range also offers high definition resolutions and are commonly used in medical displays where extra fine detail is required.


NEC’s SFT technology was first developed to be labelled as Advanced-SFT (A-SFT) which offered enhanced luminance figures. This then developed further to Super Advanced-SFT (SA-SFT) where colour gamut reached 72% of the NTSC colour space, and then to Ultra Advanced-SFT (UA-SFT) where the gamut was still at 72% or higher, but with a further enhancement of the luminance as compared with SA-SFT. These changes were all made possible thanks to the improved transmissivity of the SFT technology. More information is available from NEC LCD
Response Time
Response Time is the spec which many people, especially gamers, have come to regard as the most important. In practical terms the spec is designed to refer to the speed of the liquid crystal pixels and how quickly they can change from one colour to another, and therefore how fast the picture can be redrawn. The faster this transition can change, the better, and with more fluid changes the images can change overall a lot faster. This helps reduce the effects of blurring and ghosting in games and movies which can be an issue if response time is too slow. As a general rule of thumb, the lower the response time, the better.
Do not rely entirely on response time specs quoted by manufacturers as a be all and end all to the monitor’s performance. Different manufacturers have different ways of measuring their response time, and one 5ms panel might not be the same in real use to another 5ms panel for instance. Panel technology also plays a part here, and don’t get confused with standard response times and grey to grey (G2G) figures. However, response times can be treated a guide to the performance of the screen, and as a rule of thumb, the lower the better.
Response Time In More Detail
The traditional response time standard (ISO response time) is measured as the rise time (tR) and fall time (tF) of a pixel as it changes black > white > black. The total ‘response time’ is quoted as the total of the tR + tF. On older screens users needed to be wary of the figures manufacturers quote, as sometimes the ‘response time’ can be quoted as just the rise time, and not the total response time. This measurement of the black > white > black transition was defined as the ISO standard for response time measurements before the days of ‘overdrive’ being used (discussed in a moment). The reason this particular transition was selected as the response time figure was that it was always the fastest change possible, and manufacturers therefore quoted their best measurement. The reason this was the fastest was because at the time the highest voltage was applied to the pixels to make that change (since it was the most drastic difference from black to white).
On these older panels where overdrive was not being used, in reality the response time of the pixels will vary depending on the colour change they are making. In practice, a full black > white change is not common, and instead the pixel transitions are in shades of grey, and are then passed through the RGB colour filters. The speed of change will depend on the darkness of the transition, and traditionally (before overdrive) the transitions to lighter greys will be faster. Therefore, a manufacturers quoted response time does not necessarily mean that the speed of the pixels is the same for all the transitions. It is always a good idea to see if there are any third party measurements of response time for any given screen before considering how fast a panel really is in practice. Also take into account perceived response time measurements and comparisons between screens as we carry out in our reviews.

Take for instance this example response time graph (rise times from 0 > x) I have put together. The X-axis defines the grey scale ranging from code 0 to code 255, and the Y-axis shows the response time across this range. As you progress to the right of the graph, the transitions are getting progressively lighter. So for instance at code 100 the transition is from black > dark grey, but at code 200 the transition is from black > light grey. At code 255, this is the change from black > white and is traditionally the fastest transition. It is the fastest because this is the widest change and therefore the largest voltage is applied to the liquid crystals. For many years, manufacturers have quoted the fastest transition of the panel as the figure for ‘response time’. This was always at the black > white > black transition and so this became accepted as the ISO standard norm for measuring response time. If this graph were a real panel, it would very likely be quoted as a 10ms screen and shows a characteristic curve for a traditional, non-overdriven, TN Film panel.
As you can see from the graph, the actual response time can vary quite considerably across the whole grey range, with some changes being much slower. This is the reason you cannot always rely on quoted specs to give an accurate representation of a screens actual pixel response performance. The quoted figures from manufacturers should be treated as a rough guide however to a panels response time, as generally there has been some improvements in the overall latency with the changes from 25ms > 16ms > 12ms > 8ms > 5ms panel generations for instance. The shape of the graph is likely to remain quite similar, but overall, the curve will probably be a little lower when comparing an 8ms to a 16ms for instance. Overall it won’t be twice as fast though.
Response Times and Different Panel Technologies
One thing to note regarding pixel response time is that the overall performance of the TFT will also depend on the technology of the panel used. TN film panels offer response time graphs similar to that above, but screens based on traditional VA / IPSvariant panels can show response time graphs more like this (we are assuming for now non-overdriven panels):
This is again a mock up, but shows a typical curve shape you may expect from a VA / IPS panel (not using overdrive) when compared with TN film. Although a VA/IPS screen might be quoted as perhaps 12ms for instance, this might not mean it is as reactive as a 12ms TN film panel. Again, it is a good idea to check for reviews which measure the response time across the whole range as well as to consider real-life responsiveness tests such as those we carry out in our reviews.
Response Time Changes and the Introduction of Overdrive

Overdrive or ‘Response Time Compensation’ (RTC) is a technology which is designed to boost the response times of pixels across all transitions, with particular focus on improving the grey to grey changes which is the most important as those transitions are far more common in real-life uses. It is achieved by sending an over-voltage to the pixels to make them change orientation more quickly. While the full black > white change remains largely unchanged (since it already received the maximum voltage anyway), improvements across other transitions are often dramatic. With the introduction of overdriven panels the ISO point is not always the fastest transition any more, and so if a monitor has a response time quoted as “grey to grey / G2G” then you can be pretty certain it is using overdrive technology. The manufacturers still want to quote the fastest response time of their panel and show the improvements they have made though, but be wary of this change away from the ISO standard of quoting response times. The ISO response times have hit a wall really with TN Film stuck at 5 – 8ms, IPS stuck at around 16ms and MVA/PVA stuck at about 12ms. However, with the introduction of overdrive technologies, the more important grey to grey transitions are now significantly improved, and response times of 1 – 5ms G2G are now common place. These technologies have allow significant improvements in all panel technologies, but particularly in IPS and VA panels where response times were previously poor.
How Response Time Is Reviewed
Some reviews sites including TFTCentral have access to advanced photosensor (photodiodе + low-noise operational amplifier) and oscilloscope measurement equipment which allows them to measure response time as detailed above. See our article about response times for more information on that method. Graphs showing response time according to their equipment are produced. Other sites rely on observed responsiveness to compare how well a panel can perform in practice and what a user might see in normal use. We think it is important to study both methods if possible to give a fuller picture of a panels performance. For visual tests TFTCentral uses a program called PixPerAn (developed by Prad.de) which is good for comparing monitor responsiveness with its series of tests. The favourite seems to be the moving car test as shown here:

Perfect screen with no notable blurring / ghosting

Screen shows ghosting of 3 images
Movement isn’t perfectly fluid. Depending on its speed, the car is shown in several successive positions. If the car goes very fast, the positions are very close and the eye perceives a flowing movement. A monitor without ghosting effects would have previous images completely fading away when a new one appears. This is the theory and in practice, it’s often not the case as images fade progressively. Sometimes up to 5 afterglow images remain on the monitor and represent the visible white trail behind objects. Some monitors have strong overdrives in addition to image anticipation algorithms and where these are too aggressively applied, or poorly controlled, it can result in problems. In this case, an image can appear in front or behind the main object, creating a white or dark halo commonly.
We use this software to test the monitors we review, capturing images using a camera and comparing the best case and worst case examples. This gives us a good way to compare screens side by side and evaluate a screens responsiveness in practice. We then combine those visual tests with the more advanced oscilloscope measurements to give a comprehensive understanding of a panels response times and gaming performance.
Pursuit Camera Tests
In addition to pixel response time measurements and visual tests described above, it is also possible to capture the levels of blurring and smearing the human eye will experience on a display. This is achieved using a pursuit camera setup. They are simply cameras which follow the on-screen motion and are extremely accurate at measuring motion blur, ghosting and overdrive artefacts of moving images. Since they simulate the eye tracking motion of moving eyes, they can be useful in giving an idea of how a moving image appears to the end user. It is the blurring caused by eye tracking on continuously-displayed refreshes (sample-and-hold) that we are keen to analyse with this new approach. This is not pixel persistence caused by response times; but a different cause of display motion blur which cannot be captured using static camera tests. Low response times do have a positive impact on motion blur, and higher refresh rates also help reduce blurring to a degree. It does not matter how low response times are, or how high refresh rates are, you will still see motion blur from LCD displays under normal operation to some extent and that is what this section is designed to measure. Further technologies specifically designed to reduce perceived motion blur are required to eliminate the blur seen on these type of sample-and-hold displays which we will also look at.
For these tests we use the Blurbusters.com Ghosting Motion Test which is designed to be used with pursuit camera setups. The pursuit camera method is explained at BlurBusters. We carry out the tests at various refresh rates, with and without any Blur Reduction mode enabled. These UFO objects were moving horizontally at 960 pixels per second, at a frame rate matching refresh rate of the monitor.
Example pursuit camera blur tests
These tests capture the kind of blurring you would see with the naked eye when tracking moving objects across the screen (example from the Asus ROG Swift PG279Q). As you increase the refresh rate the perceived blurring is reduced, as refresh rate has a direct impact on motion blur. It is not eliminated entirely due to the nature of the sample-and-hold LCD display and the tracking of your eyes. No matter how fast the refresh rate and pixel response times are, you cannot eliminate the perceived motion blur without other methods. Tests like the above would give you an idea of the kind of perceived motion blur range when using the particular screen without any bur reduction mode active.
On screens with blur reduction backlights it is possible to greatly reduce the perceived motion blur. With these blur reduction features enabled the backlight is strobed briefly, once per refresh, for low persistence. The brief backlight flash prevents tracking-based motion blur and the moving object is far easier to see when tracking it across the screen with your eyes (or by the pursuit camera). Normally these blur reduction modes lead to extremely little leftover ghosting caused by pixel transitions (virtually invisible to the human eye), since nearly all (>99%+) pixel transitions, including overdrive artefacts, are now kept unseen by the human eye, while the backlight is turned off between refreshes.
The clarity of the moving image is improved significantly and tracking across the screen with your eye is much easier and clearer. These kind of tests give you a good visual indication of the improvements which blur reduction backlights can bring in perceived motion blur.
Contrast Ratio
The Contrast Ratio of a TFT is the difference between the darkest black and the brightest white it is able to display. This is really defined by the pixel structure and how effectively it can let light through and block light out from the backlight unit. As a rule of thumb, the higher the contrast ratio, the better. The depth of blacks and the brightness of the whites are better with a higher contrast ratio. This is also referred to as the static contrast ratio.
When considering a TFT monitor, a contrast ratio of 1000:1 is pretty standard nowadays for TN Film and IPS-type panels. VA-type panels can offer static contrast ratios of 3000:1 and above which are significantly higher than other competing panel technologies.
Some technologies boast the ability to dynamically control contrast (Dynamic Contrast Ratio – DCR) and offer much higher contrast ratios which are incredibly high (millions:1 for instance!). Be wary of these specs as they are dynamic only, and the technology is not always very useful in practice. Traditionally, TFT monitors were said to offer poor black depth, but with the extended use of VA panels, the improvements from IPS and TN Film technology, and new Dynamic Contrast Control technologies, we are seeing good improvements in this area. Black point is also tied in to contrast ratio. The lower the black point, the better, as this will ensure detail is not lost in dark image when trying to distinguish between different shades.
Brightness / Luminance
Brightness as a specification is a measure of the brightest white the TFT can display, and is more accurately referred to as its luminance. Typically TFT’s are far too bright for comfortable use, and the On Screen Display (OSD) is used to turn the brightness setting down. Brightness is measure in cd/m2 (candella per metre squared). Note that the recommended brightness setting for a TFT screen in normal lighting conditions is 120 cd/m2. Default brightness of screens out of the box is regularly much higher so you need to consider whether the monitor controls afford you a decent adjustment range and the ability to reduce the luminance to a comfortable level based on your ambient lighting conditions. Different uses may require different brightness settings as well so it is handy when reviews record the luminance range possible from the screen as you adjust the brightness control from 100 to 0%.
Colour Depth
The colour depth of a TFT panel is related to how many colours it can produce and should not be confused with colour space (gamut). The more colours available, the better the colour range can potentially be. Colour reproduction is also different however as this related to how reliably produced the colours are compared with those desired.
| Panel Colour Depth | Total Bits Per Colour | Steps Per Sub pixel | Total Colours |
| 6-bit | 18-bit | 64 | 262,144 |
| 6-bit + FRC | – | – | 16.2 – 16.7 million |
| 8-bit | 24-bit | 256 | 16.7 million |
| 8-bit + FRC | “30-bit” | 256 | 1.07 billion |
| 10-bit | 30-bit | 1024 | 1.07 billion |
The colour depth of a panel is determined really by the number of possible orientations of each sub pixel (red, blue and green). These different orientations basically determine the different shade of grey (or colours when filtered in the specific way via RGB sub pixels) and the more “steps” between each shade, the more possible colours the panel can display.
At the lower end, TN Film panels are normally quite economical, and their sub pixels only have 64 possible orientations each, giving rise to a true colour depth of only 262,144 (i.e. 64 steps on each RGB = 64 x 64 x 64 = 18). This is also referred to commonly s 18-bit colour (i.e. 6 bits per RGB sub pixel = 6 + 6 + 6) This colour depth is pretty limited and so in order to reach 16 million colours and above, panel manufacturers commonly use two technologies: Dithering and Frame Rate Control (FRC). These terms are often interchanged, but strictly can mean different things. These technologies simulate other colours allowing the colour depth to improve to typically 16.2 million colours.
- Spatial Dithering – The dithering method involves assigning appropriate colour values from the available colour palette to close-by pixels in such a way that it gives the impression of a new colour tone which otherwise could not have been created at all. In doing so, there complex mappings according to which the ground colours are mutually assigned, otherwise it could result in colour noise / dithering noise. Dithering can be used to allow 6-Bit panels, like TN Film, to show 16.2 million perceived colours. This can however sometimes be detectable to the user, and can result in chessboard like patterns being visible in some cases.
- Frame Rate Control / Temporal Dithering – The other method is Frame-Rate-Control (FRC), also referred to sometimes as temporal dithering. This works by combining four colour frames as a sequence in time, resulting in perceived mixture. In basic terms, it involves flashing between two colour tones rapidly to give the impression of a third tone, not normally available in the palette. This allows a total of 16.2 reproducible million colours. Thanks to Frame-Rate-Control, TN panel monitors have come pretty close to matching the colours and image quality of VA or IPS panel technology, but there are a number of FRC algorithms which vary in their effectiveness. Sometimes, a twinkling artefact can be seen, particularly in darker shades, which is a side affect of such technologies. Some TN Film panels are now quoted as being 16.7 million colours, and this is down to new processes allowing these panels to offer a better colour depth compared with older TN panels.
Other panel technologies however can offer more possible pixel orientations and therefore more steps between each shade. VA and IPS panels are traditionally capable of 256 steps for each RGB sub pixel, allowing for a possible 16.7 million colours (true 8-bit, without FRC). These are referred to as 8-bit panels with 24-bit colour (8-bit per sub pixel = 8 + 8 + 8 = 24). While most IPS and VA panels support 8-bit colour, modern IPS and VA panels do sometimes use 6-bit + FRC instead. See this news piece for further information.
10-bit colour depth is typically only used for very high end graphics uses and in professional grade monitors. There are three main ways of implementing 10-bit colour depth support. Most screens which are advertised as having 10-bit support are actually using true 8-bit panels. There is an additional FRC stage added to extend the colour palette. This FRC can be applied either on the panel side (8-bit + FRC panels) or on the monitor LUT/electronics side. Either way, the screen simulates a larger colour depth and does not offer a ‘true’ 10-bit support. You can also only make use of this 10-bit support if you have a full end-to-end 10-bit workflow, including a supporting software, graphics card and operating system. There are a few ‘true’ 10-bit panels available but these are prohibitively expensive and rarely used at the moment. See our panel parts database for more information about different panels.
Colour Space / Gamut and Backlighting Type

Colour gamut in TFT monitors refers to the range of colours the screen is capable of displaying, and how much of a given reference colour space it might be able to display. It is ultimately linked to backlight technology and not to the panel itself.
Experiments at the beginning of the last century into the human eye eventually led to the creation of a system that encompassed all the range of colours our eyes can perceive. Its graphical representation is called a CIE diagram as shown in the image above. All the colours perceived by the eye are within the collared area. The borderline of this area is made up of pure, monochromatic colours. The interior corresponds to non-monochromic colours, up to white which is marked with a white dot. ‘White Colour’ is actually a subjective notion for the eye as we can perceive different colours as white depending on the conditions. The white dot in the CIE diagram is the so-called flat spectrum dot with coordinates of x=y=1/3. Under ordinary conditions, this colour looks very cold, bluish.
Above: CIE diagram showing total gamut range of the human eye
If we had three sources of different colours the question is which other colours can be made by mixing the sources? If you mark points with the coordinates of the basic colours in the CIE diagram, everything you can get by mixing them up is within the triangle you can draw by connecting the points. This triangle is referred to as a colour gamut.

Above: gamut triangle of a laser display
Laser Displays are capable of producing the biggest colour gamut for a system with three basic colours, but even a laser display cannot reproduce all the colours the human eye can see, although it is quite close to doing that. However, in today’s monitors, both CRT and LCD (except for some models I’ll discuss below), the spectrum of each of the basic colours is far from monochromatic. In the terms of the CIE diagram it means that the vertexes of the triangle are shifted from the border of the diagram towards its centre.

Above: sRGB colour space triangle
CCFL Backlighting
The colour space produced by any given TFT monitor is defined by its backlighting unit and is not influenced by the panel technology.
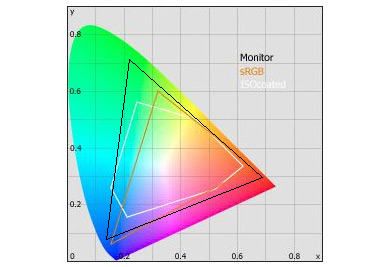
Traditionally, LCD monitors were capable of giving approximate coverage of the sRGB reference colour space as shown in the diagram above. This is defined by the backlighting used in these displays – Cold-cathode fluorescent lamps (CCFL) that are employed which emit radiation in the ultraviolet range which is transformed into white colour with the phosphors on the lamp’s walls. These backlight lamps shine through the LCD panel, and through the RGB sub-pixels which act as filters for each of the colours. Each filter cuts a portion of spectrum, corresponding to its pass-band, out of the lamp’s light. This portion must be as narrow as possible to achieve the largest colour gamut.
Traditional CCFL backlighting offers a gamut pretty much covering the sRGB colour space. However, the sRGB space is a little small to use as a reference in specifications for colour gamuts and so the larger NTSC colour space reference is also sometimes used. The sRGB space corresponds to approximately 72% of the NTSC colour space, which is a figure commonly used in specifications for standard CCFL backlit monitors. If you read the reviews here, you will see that analysis with colorimeter devices allows us to measure the colour gamut, and you can easily spot those screens utilising regular CCFL backlighting by the fact their gamut triangle is pretty much mapped to the reference sRGB triangle. The sRGB colour space is lacking most in green hues as compared with the gamut of the human eye. It should be noted that most content is produced based on the sRGB colour space, including Windows, many popular applications and internet content.
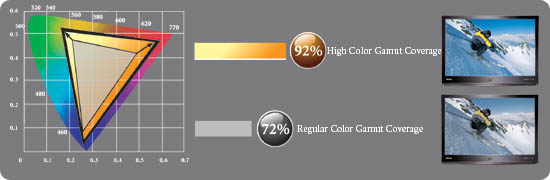
Wide Colour Gamut CCFL Backlighting (WCG-CCFL)


Above Left: a typical measurement of a standard CCFL backlit monitor, covering pretty much the sRGB colour space, 72% of NTSC colour space
Above Right: a typical measurement of a monitor with enhanced CCFL backlighting, covering more than the sRGB colour space and about 92% of the NTSC space
To help develop and improve on the colour space a screen is capable of displaying a new generation CCFL backlighting was introduced. These so-called “wide gamut” backlights allow a gamut coverage of typically 92 – 102% of the NTSC colour space. There is a difference in practice which all users should be able to detect. The colour space available is extended mainly in green shades as you can see from the image above. Red coverage is also extended in some cases. This extended colour space sounds appealing on face value since the screens featuring WCG-CCFL backlighting can offer a broader range of colours. Manufacturers will often promote the colour space coverage of their screens with these high figures. In practice you need to consider what impact this would have on your use.
It’s important to consider what colour space your content is based around. sRGB has long been the preferred colour space of all monitors, and is in fact the reference for the Windows operating system and the internet. As such, most content an average user would ever use is based on sRGB. If you view sRGB content on a wide gamut screen then this can lead to some colours looking incorrect as they are not mapped correctly to the output device. In practice this can lead to oversaturation, and greens and reds can often appear false, oversaturated or neon-like. Colour managed applications and a colour managed workflow can prevent this but for the average user the cross-compatibility of widely used sRGB content and a wide gamut screen may present problems and prove troublesome. Some users don’t object to the over saturated and ‘cartoony’ colours for their use, but to many, it is an issue.
Of course the opposite is true if in fact you are working with content which is based on a wider colour space. In photography, the Adobe RGB colour space is often used and is wider than the sRGB reference. If you are working with wide gamut content, with wide gamut supported applications, you would want a screen that can correctly display the full range of colours. This could not be achieved using a traditional CCFL backlit display with only sRGB coverage, and so a wide gamut screen would be needed. Wide gamut displays are often aimed at colour enthusiasts and professional uses as a result.
A compromise is sometimes available in the form of a screen which can support a range of colour spaces accurately. Some higher end screens come with a wide gamut backlight unit. Natively these offer a gamut covering 92 – 102% of the NTSC colour space. However, they also feature emulation modes which can simulate a smaller colour space. These emulation modes are normally available through the OSD menu and offer varying options with varying degrees of reliability. In the best cases the screens can emulate the smaller Adobe RGB colour space, and also the sRGB colour space. This allows the user to work in whichever colour space they prefer but gives them compatibility with a wider range of content if they have the need. The success of these colour space emulations will vary from one screen to another however and are not always accurate. Obviously you are still paying additional money for the wide gamut support, so if you’re only really interested in using sRGB mode then you’d probably be better looking for a standard gamut backlit screen.
Further reading: X-bit Labs Article
LED Backlighting
LED backlighting has now become the norm for desktop monitors and is available in a few variations. The most common is White-LED (W-LED), which is a replacement for standard CCFL backlighting. The LED’s are placed in a line along the edge of the matrix, and the uniform brightness of the screen is ensured by a special design of the diffuser. The colour gamut is limited to sRGB as standard (around 68 – 72% NTSC) but the units are cheaper to manufacturer and so are being utilised in more and more screens, even in the more budget range. They do have their environmental benefits as they can be recycled, and they have a thinner profile making them popular in super-slim range models and notebook PC’s. It is possible to extend the colour gamut of W-LED displays using “Quantum Dot” technologies which are fairly new.
Above: colour gamut of a typical LED backlit display, covering 114% of the NTSC colour space
RGB LED backlighting consists of an LED backlight based on RGB triads, each triad including one red, one green and one blue LED. With RGB LED backlighting the spectrum of each LED is rather wide, so their radiation can’t be called strictly monochromatic and they can’t match a laser display, yet they are much better than the spectrum of CCFL and WCG-CCFL backlighting. RGB LED backlighting is not common yet in desktop monitors, and their price tends to put them way above the budget of all but professional colour enthusiast and business users. These models using RGB LED backlights are capable of offering a gamut covering > 114% of the NTSC colour space. They are not really used at all nowadays as they were prohibitively expensive.
There are also wide gamut LED backlights available and more commonly used nowadays as they are cheaper to manufacturer than older RGB LED versions. GB-r-LED for instance is provided by LG.Display and can offer wide gamut support from an LED backlight. Other panel manufacturers have their equivalents as well. Modern LED screens with wide gamut support tend to have a percentage coverage of the Adobe RGB reference space listed in the display spec, with 99% Adobe RGB being pretty standard for wide gamut LED technologies.
Further reading: LED Backlighting Article
Gamut References

You will commonly see a monitor’s gamut listed as a percentage compared with a reference colour space. This will vary depending on which reference a manufacturer uses, but commonly you will see a % against the NTSC or Adobe RGB colour spaces. Bear in mind also that the gamut / colour space of the sRGB standard equates to about 72 – 75% of the NTSC reference. This is the standard colour space for the Windows operating system and the internet, and so where extended colour spaces are produced from a monitor, considerations need to be made as to the colour space of the content you are viewing.
Here is how several of the colour spaces are linked:
| NTSC (%) | Adobe RGB (%) |
| 72 | |
| 92 | 95 |
| 102 | 97.8 |
| 116 | 114 |
| 125 | 123 |
Viewing Angles

Viewing angles are quoted in horizontal and vertical fields and often look like this in listed specifications: 170/160 (170° in horizontal viewing field, 160° in vertical). The angles are related to how the image looks as you move away from the central point of view, as it can become darker or lighter, and colours can become distorted as you move away from your central field of view. Because of the pixel orientation, the screen may not be viewable as clearly when looking at the screen from an angle, but viewing angles of TFT’s vary depending on the panel technology used.
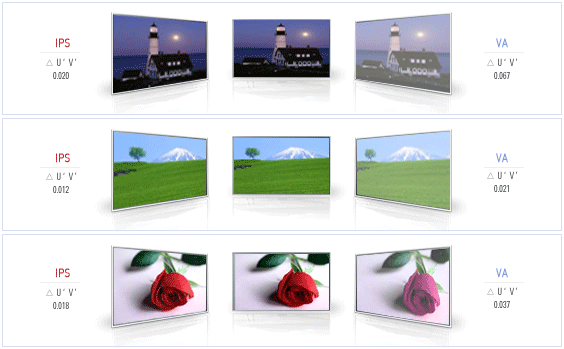
As a general rule, the viewing angles are IPS-type > VA-type > TN Film. The viewing angles are often over exaggerated in manufacturers specs, especially with TN Film panels where quoted specs of 160 / 160 and even 170 / 170 are based on overly loose measuring techniques. Be wary of 176/176 figures as these are sometimes used as over-exaggerated specs for a TN Film panel and are based on more lapse measurement techniques as well.
In reality, IPS and VA panels are the only technologies which can truly offer wide viewing fields and are commonly quoted as 178/178. VA panels can show a colour / contrast distortion as you move slightly away from a central point. While most people do not notice this anomaly, others find it distracting. They also show more apparent contrast and gamma shifts with changes in the users line of sight. IPS-type panels do not suffer from this and are generally considered the superior technology for wide fields of view.
Further reading: ViewSonic’s Whitepaper – Why Viewing Angle is a Key Element in Choosing an LCD
Refresh Rate
On a CRT monitor, the refresh rate relates to how often the whole screen is refreshed by a cathode ray gun. This is fired down the screen at a certain speed which is determined by the vertical frequency set in your graphics card. If the refresh rate is too low, this can result in flickering of the screen and is often reported to lead to head aches and eye strain. On a CRT, a refresh rate of 72Hz is deemed to be “flicker free”, but generally, the higher the refresh rate the better.
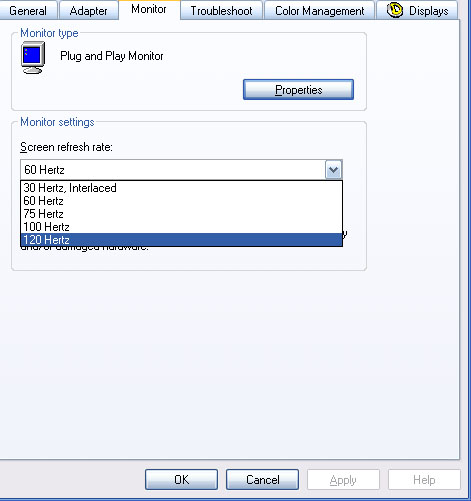
TFT screens do not refresh in the same way as a CRT screen does, where the image is redrawn at a certain rate. As a TFT is a static image, and each pixel refreshes independently, setting the TFT at a common 60Hz native refresh rate does not cause the same problems as it would on a CRT. There is no cathode ray gun redrawing the image as a whole on a TFT. You will not get flicker, which is the main reason for having a high refresh rate on a CRT in the first place. Standard TFT monitors operate with a 60Hz recommended refresh rate, but can sometimes support up to 75Hz maximum (within the spec) or sometimes even further using ‘overclocking’ methods. The reason that 60Hz is recommended by all the manufacturers is that it is related to the vertical frequency that TFT panels run at. Some more detailed data sheets for the panels themselves clearly show that the operating vertical frequency is between about 56 and 64Hz, and that the panels ‘typically’ run at 60Hz (see the LG.Philips LM230W02 datasheet for instance – page 11). If you decide to run your refresh rate from your graphics card above the recommended 60Hz it will work fine, but the interface chip on the monitor will be in charge of scaling the frequency down to 60Hz anyway. Some screens will allow you to run at the maximum 75Hz as well for an additional boost in frame rates and some minor improvements in motion clarity. The support of this will really depend on the screen, your graphics card and the video connection being used. You may find the screen operates fine at the higher refresh rate setting but in reality the screen will often drop frames to meet the 60Hz recommended setting (or spec of the panel) anyway. Generally we would suggest sticking to 60Hz on standard TFT monitors.
One thing which some people are concerned about is the frames per second (fps) which their games can display. This is one of the key reasons users will look to boost their screen beyond 60Hz. This is related to the refresh rate of your screen and graphics card. There is an option for your graphics card to enable a feature called Vsync which synchronizes the frame rate of your graphics card with the operating frequency of your graphics card (i.e. the refresh rate). Without vsync on, the graphics card is not limited in it’s frame rate output and so will just output as many frames as it can. This can often result in graphical anomalies including ‘tearing’ of the image where the screen and graphics card are out of sync and the picture appears mixed as the monitor tries to keep up with the demanding frame rate from the card. To avoid this annoying symptom, vsync needs to be enabled. With vsync on, the frame rate that your graphics card is determined by the refresh rate you have set in Windows. Capping the refresh rate at 60hz in your display settings limits your graphics card to only output 60fps. If you set the refresh at 75hz then the card is outputting 75fps. What is actually displayed on the monitor might be a different matter though as we explained above.
The desire to offer higher frame rate support and higher refresh rates has lead to panel manufacturers developing panels which can natively support 120Hz+. It is common now to see 120Hz or 144Hz as natively supported refresh rates. This allows much higher frame rates to be displayed and the increase in refresh rate also brings about positive improvements in perceived motion clarity. TN Film panels have been around for many years now with high refresh rates and in recent years there has been development in IPS-type and VA-type panels to boost their refresh rates as well. You will also now see some ‘overclocked’ monitors available where manufacturers have attempted to boost the refresh rate further. For instance the native 144Hz IPS-type panel of the Asus ROG Swift PG279Q up to 165Hz, or the 144Hz native VA-type panel of the Acer Predator Z35 up to 200Hz. Results of these overclocks do vary and are not guaranteed but may provide some additional benefits.
120Hz Monitors and LCD TV’s
You will see more mention of higher refresh rates from both LCD televisions and now desktop monitors. It’s important to understand the different technologies being used though and what constitutes a ‘real’ 120Hz and what is ‘interpolated’:
- Interpolated 120Hz+ – These technologies are the ones commonly used in LCD TV’s where TV signal input is limited to 50 / 60 Hz anyway (depending on PAL vs NTSC). To help overcome the issues relating to motion blur on such sets, manufacturers began to introduce a technology to artificially boost the frame rate of the screen. This is done by an internal processing within the hardware which adds an intermediate and interpolated (guessed / calculated) frame between each real frame, boosting from 50 / 60fps to 100 / 120 fps. This technology can offer a noticeable improvement in practice when it is controlled very well. Some sets even have 240 and 480Hz technologies which operate in the same way, but with further interpolation and inserted frames. See here for further information.
- True 120HZ technology – to have a true 120Hz screen, it must be capable of accepting a full 120Hz signal output from a device (e.g. a graphics card). Because TV’s are limited at the moment by their input sources they tend to use the above interpolation technology, but with the advent of 3D TV and higher frequency input sources, this will change. Desktop monitors are a different matter though as graphics cards can obviously output a true 120Hz if you have a decent enough card. Some models can accept a 120Hz signal but need different interfaces to cope (e.g. dual-link DVI or DisplayPort).
Power Consumption

Manufacturer specifications will usually list power consumption levels for the monitor which tell you the typical power usage you can expect from their model. This can help give you an idea of running costs, carbon footprint and electricity demands which are particularly important when you’re talking about multiple monitors or a large office environment. Power consumption of an LCD monitor is typically impacted by 3 areas:
1) Brightness and the intensity of the backlight – turning up the brightness control on a screen will normally result in a higher power usage
2) Backlight type – LED backlight units can typically offer lower power consumption than CCFL units (when running at the same luminance level)
3) Connected peripherals – additional connections like USB powered devices can add additional pull on the power consumption
Specs will often list a typical usage for the screen, normally related to whatever the default factory brightness control / luminance is. They may also list a maximum usage, when brightness is turned up to full and sometimes also an additional maximum when USB ports are in use. A standby power usage is often also included indicating the power draw when the screen is in standby mode. Some screens also feature various presets or modes designed to help limit power consumption, often just involving preset brightness settings. Again these can be useful in multi-monitor environments.
Some technologies are also available to help reduce power consumption. These include ambient light sensors and human sensors.
Interfaces and Connectivity

This relates to the connection type from the TFT to your PC or other external device. Older screens nearly all came with an analogue connection, commonly referred to as D-sub or VGA. This allows a connection from the VGA port on your graphics card, where the signal being produced from the graphics card is converted from a pure digital to an analogue signal. There are a number of algorithms implemented in TFT’s which have varying effectiveness in improving the image quality over a VGA connection. Some TFT’s with then offer a DVI input as well to allow you to make use of the DVI output from your graphics card which you might have. This will allow a pure digital connection which can sometimes offer an improved image quality. It is possible to get DVI – VGA converters. These will not offer any improvements over a standard analogue connection, as you are still going through a conversion from digital to analogue somewhere along the line. Dual-Link DVI is also sometimes used which is a single DVI connection but with more pins, allowing for higher resolution/refresh rate support than a single-link DVI.


Some screens also offer other interfaces designed for external devices such as games consoles and DVD players. HDMI, S-Video, Composite and Component are available on some models if this functionality is appealing and are widely implemented to allow connection of other external devices. Some of these interfaces are also capable of carrying sound as well as video (e.g. HDMI). With many modern graphics cards also offering HDMI connections, the availability of these on a monitor is very useful.

Mobile High-Definition Link (MHL) is an industry standard for a mobile audio/video interface that allows consumers to connect mobile phones, tablets, and other portable consumer electronics (CE) devices to high-definition televisions (HDTVs) and monitors. You will sometimes see MHL listed in the spec and is often supported over the HDMI interfaces of a display.

DisplayPort is the most common monitor connection type nowadays, offering the highest bandwidth support and therefore being vital to provide the newest high resolution and high refresh rate panels. The DisplayPort (DP) connection comes in two types, either standard or Mini. They are interchangeable and a simple conversion cable can allow connection between each version.