AOC AGON PRO AG276QZD2

Introduction
The AG276QZD2 is part of AOC’s top tier ‘AGON PRO’ gaming series of monitors and offers a 27″ screen size with a 2560 x 1440 resolution and a 240Hz refresh rate. Usually this spec would indicate the use of an LG.Display WOLED panels, as there’s loads of 1440p @ 240Hz monitors that have come before it, including actually the company’s own AG276QZD model. What makes this new QZD2 model different though is that it’s using a different OLED technology, being built around a Samsung Display QD-OLED panel instead. So the original AG276QZD was WOLED, and this AG276QZD2 is QD-OLED.
One of the key differences with this screen and the other 27″ QD-OLED monitors on the market is that this uses a 240Hz refresh rate panel, instead of the 360Hz QD-OLED panels that Samsung Display also produce. The reason for this is that AOC are trying to make OLED monitors more mainstream and accessible, both from a price point of view and from a system requirements point of view. Powering 1440p @ 240Hz is a somewhat more achievable option for many users than 1440p @ 360Hz and so for those who have lower spec systems, who don’t need the higher frame rates and refresh rates, who perhaps don’t play competitive and fast paced games, and at the same time want to save some money – this new model tries to offer you something suitable.
We’ll talk more about the use cases later on in the review. With the QZD model and now the QZD2 available, users also have the choice between WOLED and QD-OLED monitors with a similar spec, which we will also talk more about later.
🔷 For a recent round-up of AOC’s OLED monitor range, with options and sizes to suit a wide range of user needs, check out our article here.
| Where to Buy |
 — — |
 — — |
| #affiliate. We may earn a commission if you purchase from our affiliate links in this content – TFTCentral is a participant in the Amazon Services LLC Associates Programme, an affiliate advertising programme designed to provide a means for sites to earn advertising fees by advertising and linking to Amazon.com, Amazon.co.uk, Amazon.de, Amazon.ca and other Amazon stores worldwide. We also participate in a similar scheme for Overclockers.co.uk, Newegg, Bestbuy and some manufacturers. |
Key Specs
- 27″ screen size (26.7″) with flat format and 16:9 aspect ratio
- Samsung Display QD-OLED panel
- 2560 x 1440 resolution
- 240Hz refresh rate
- Adaptive-sync for VRR including NVIDIA G-sync Compatible certification
- 250 nits typical brightness (SDR), 1000 nits peak brightness (HDR 3% APL)
- Wide colour gamut covering 99.1% DCI-P3 and 98% Adobe RGB
- VESA DisplayHDR 400 True Black certification
- 2x DisplayPort 1.4 (with DSC), 2x HDMI 2.0 video connections
- PiP and PbP support, Light FX RGB, 2x 5W integrated speakers, 2x USB data ports, 1x headphone jack
- Full adjustable stand with tilt, height, swivel and rotate

Design and Features
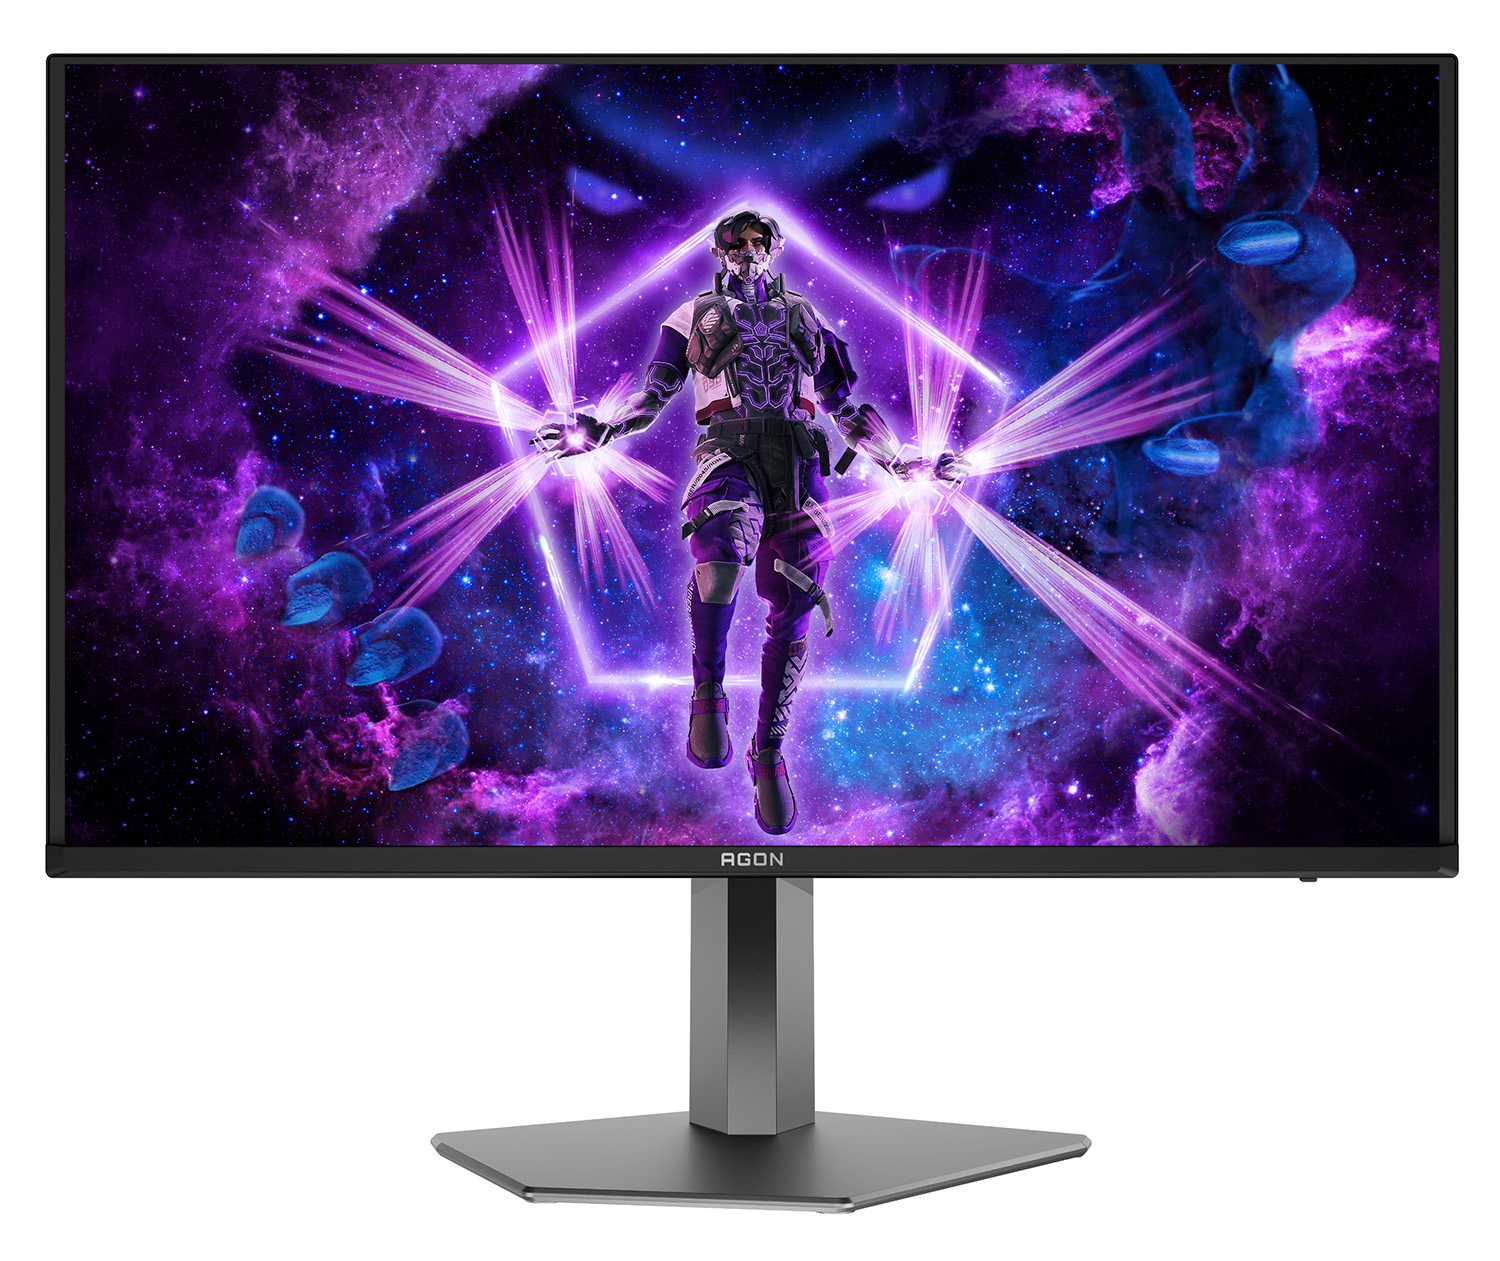

The screen comes in a black and dark grey coloured finish. The panel has a 3-side borderless design with a thin plastic edge and a black panel border before the image starts. The total border measures ~11mm along the sides, ~7.5mm along the top and ~20mm along the bottom edge. The lower edge has a larger matte black plastic bezel and an AGON logo in the middle. A white power LED is situated on the bottom right hand edge of the screen.
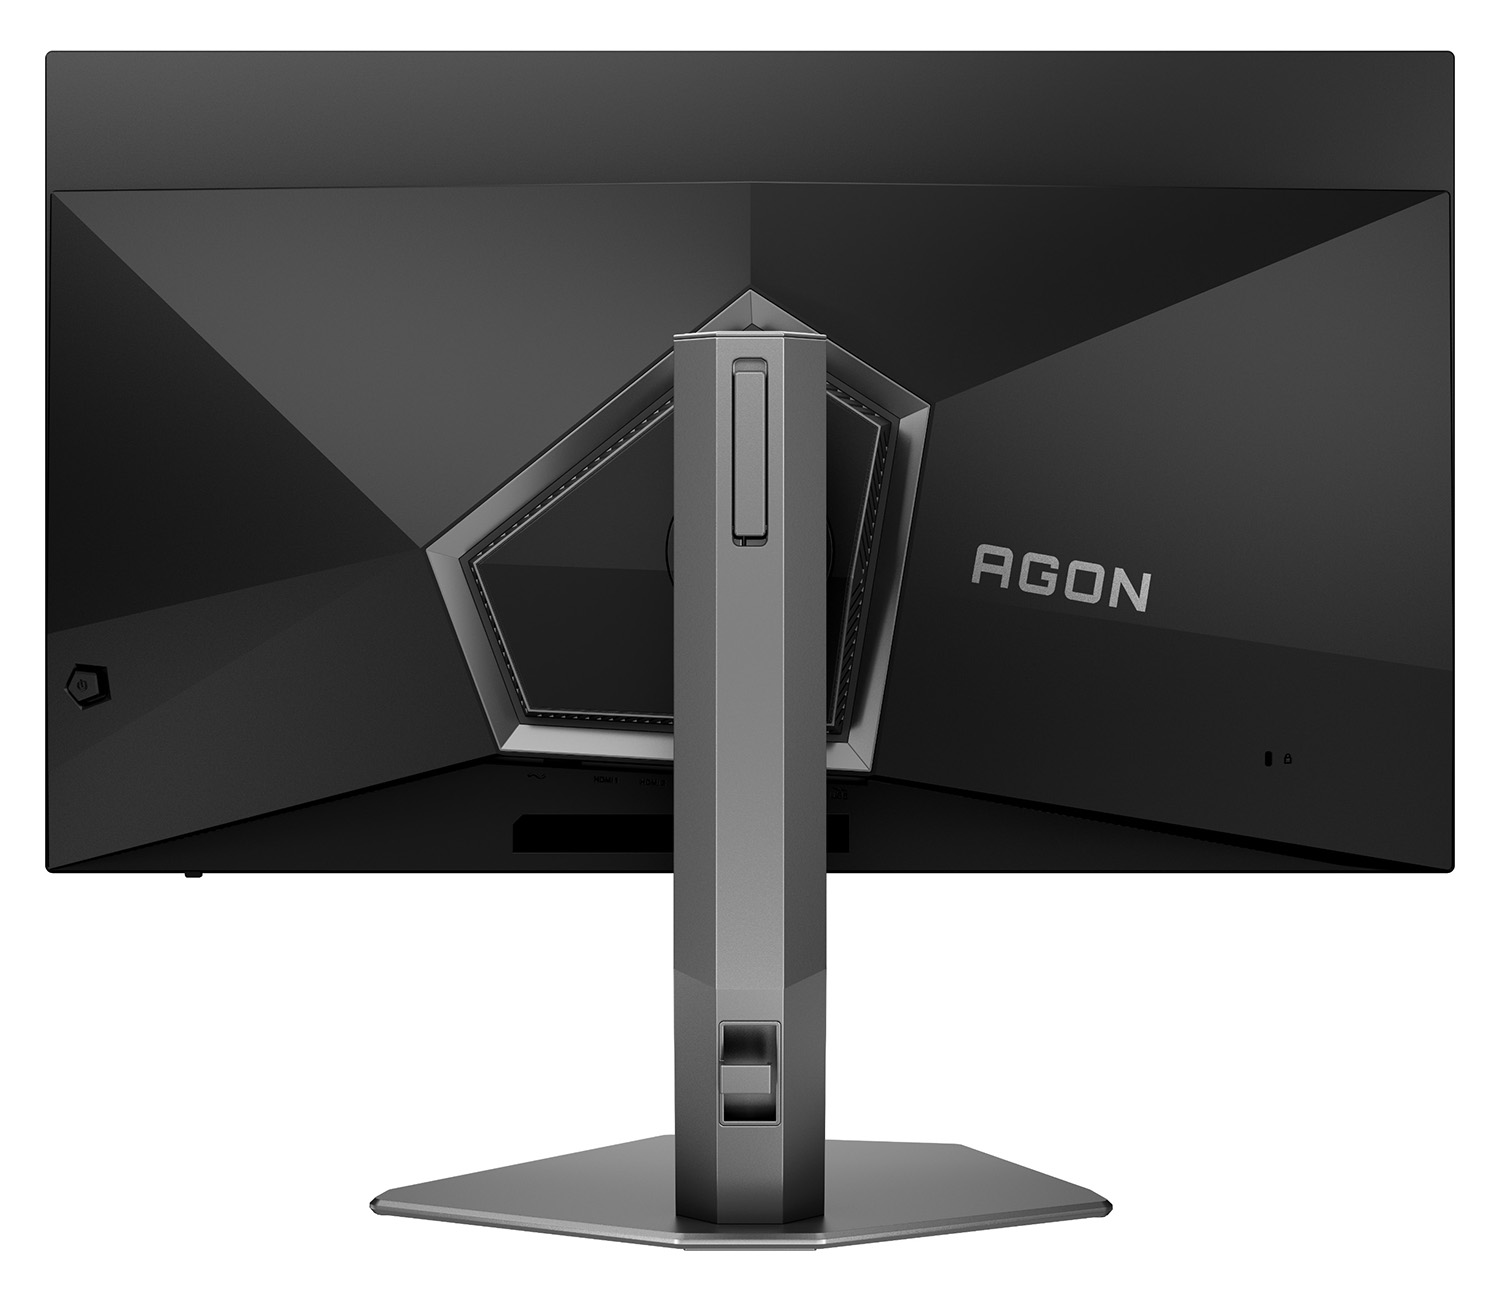
The back of the screen is encased in a matte black plastic as shown above.

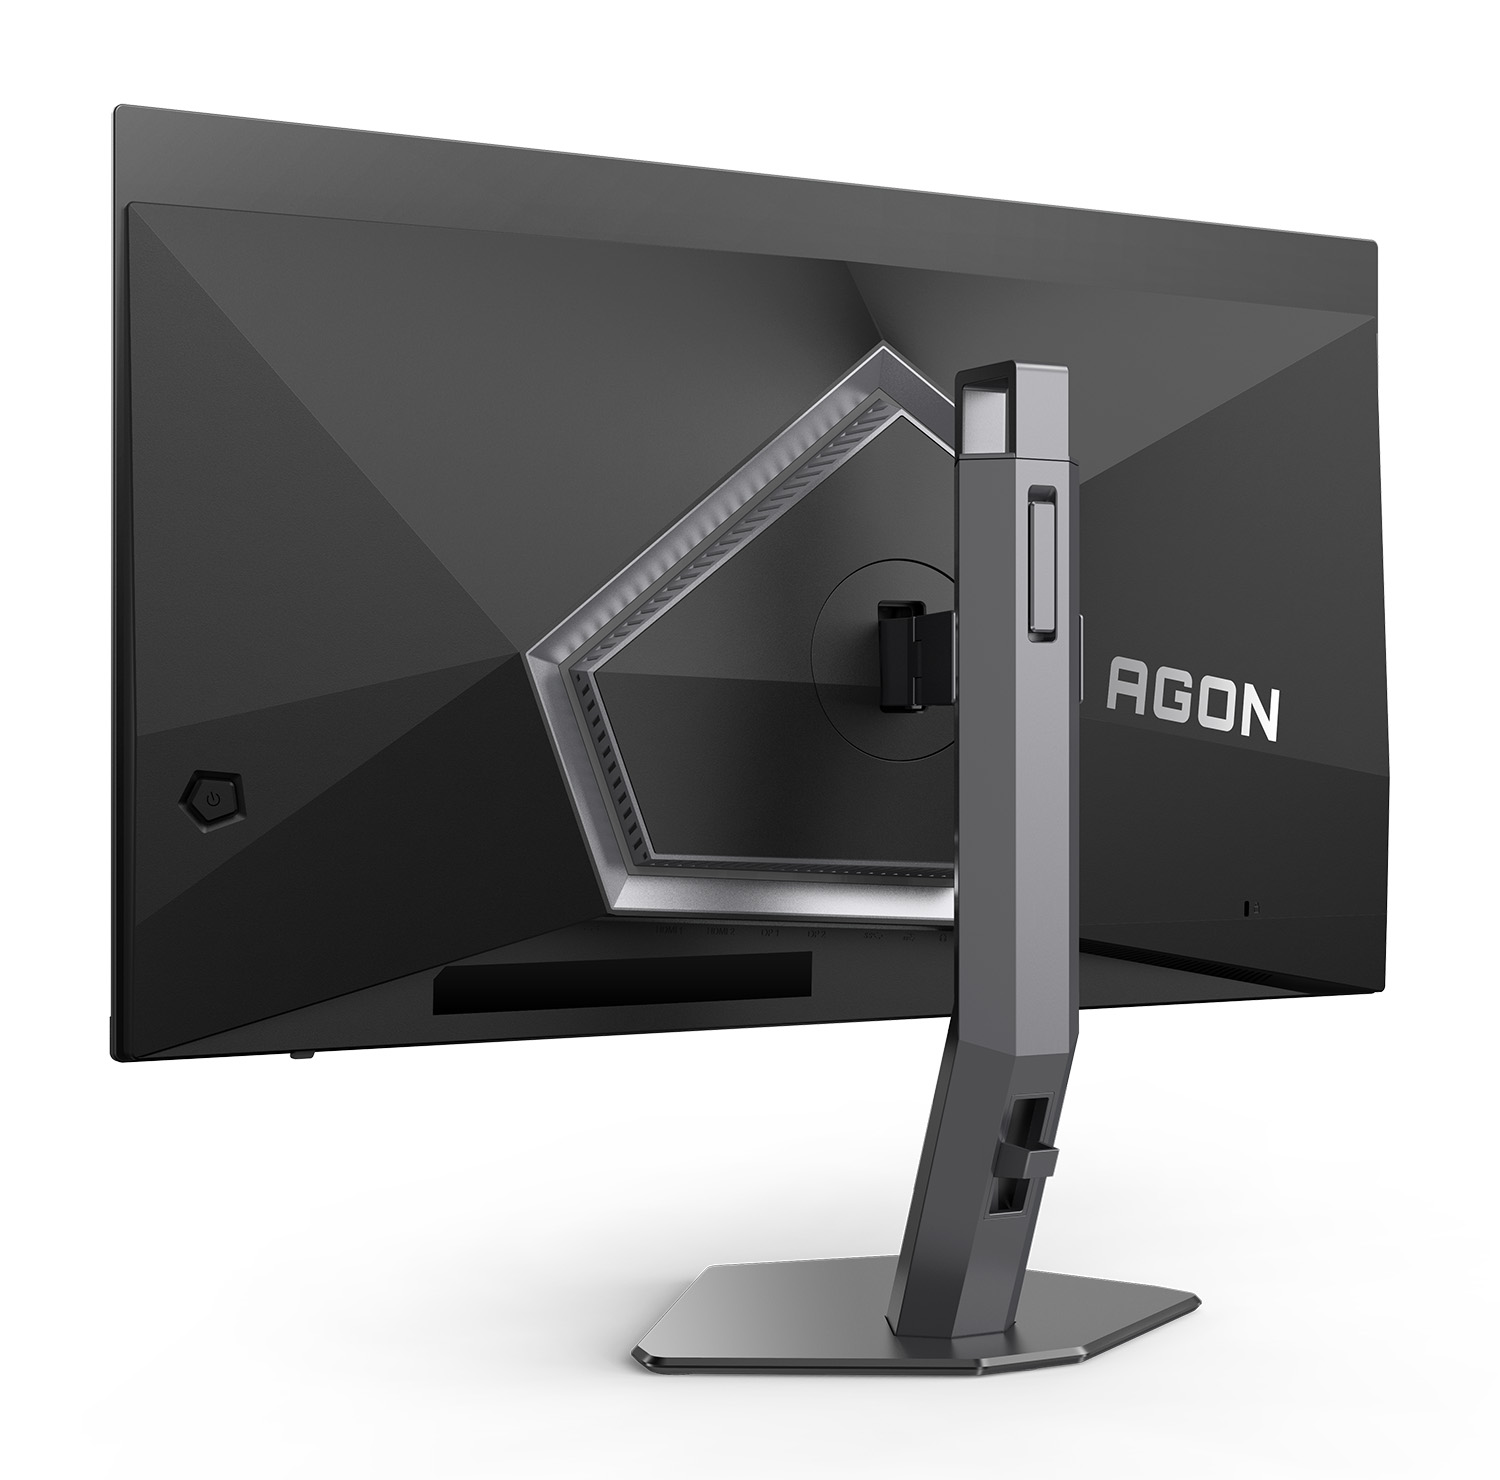
There is a ‘Light FX’ RGB lighting feature around the shaped section in the middle which can be controlled, or turned off, via the OSD menu. The stand attaches quickly and easily or can be removed in favour of VESA 100 x 100mm mounting if you’d rather. The arm of the stand features a small carry handle at the top, and a cable tidy clip on the back.
The foot of the stand has an unusual asymmetric shape as you can see from the above images, which is designed to make it easier to fit your mouse and keyboard at different angles for gaming. It’s somewhat unusual, and may be distracting for some people who like a more uniform and even design. On the other hand it looks unique and should provide decent space on your desktop for your peripherals.

Video connections are provided on the back of the screen for 1x DisplayPort 1.4 (with DSC) and 2x HDMI 2.0. There are also 2x USB data ports and a headphone connection located here. It could have been useful to have those latter connections on the side or bottom edge of the screen for easier access perhaps but at least they are included.

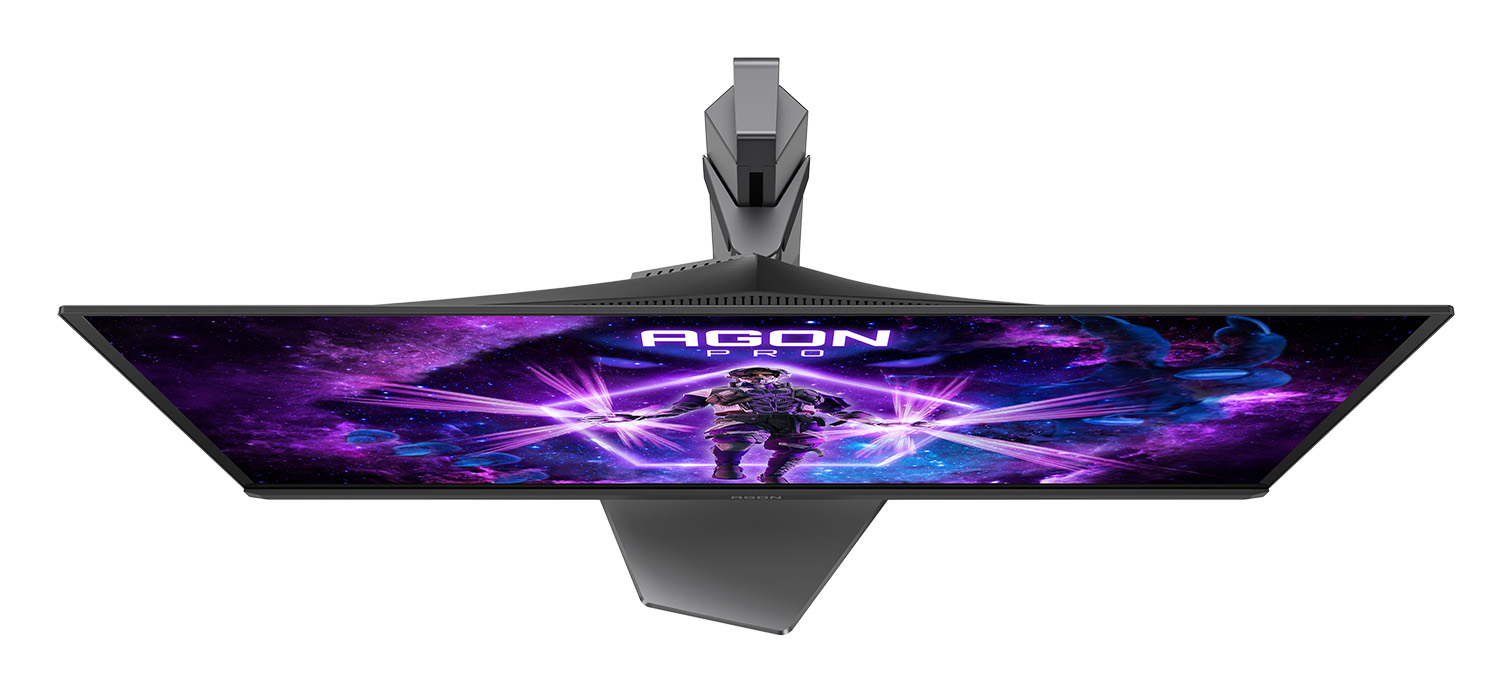
The stand provides a full range of adjustments with tilt, height, swivel and rotate available.
| Function | Featured | Smoothness | Ease of Use |
| Tilt | Smooth | A little stiff | |
| Height | Quite smooth | Quite stiff | |
| Swivel | Smooth | Easy | |
| Rotate | Quite smooth | Easy |
The OSD menu is controlled via a small joystick on the back right hand side of the screen.
| OSD Menu | |
| Joystick toggle controller | |
| Quick and snappy | |
| Intuitive to use | |
| User updatable firmware |


Navigation is quick and intuitive thanks to the joystick toggle, and there’s a wide range of settings to play with as well. There are no other buttons to control the screen at all, only the joystick toggle.
Brightness and Contrast
For this testing we disabled the OLED care features as those have a small impact to screen brightness and left the screen in its other default settings, including the Native colour space mode.

The screen offers a uniform brightness behaviour in SDR with basically the same luminance being retained regardless of the APL window size being tested and the content being displayed. The screen can reach up to 223 nits at maximum brightness setting which is moderate and a little less than most modern OLED screens we’ve tested which can reach around 260 – 280 nits with uniform brightness behaviour. It is slightly different in the other colour space modes with the sRGB mode reaching 227 nits max, and the DCI-P3 mode reaching 206 nits max.
These same brightness levels are achieved for standard desktop applications, not just in simulated test patterns. At the lowest setting the screen could reach down to a nice low 15 nits affording you good flexibility for darker room conditions though. We would have liked a slightly wider adjustment at the upper end though as it feels like it could have been pushed a little higher based on other modern OLED screens we’ve reviewed.
- Useful reading – OLED Dimming Confusion – APL, ABL, ASBL, TPC and GSR Explained
Black Depth, Shadow Detail and Contrast
| Black depth and contrast | |
| Contrast ratio | ~Infinite:1 (OLED) |
| Black depth (nits) | 0.00 |
| Shadow detail rating (SDR) | Reasonable First visible RGB = 4 |
| Shadow detail adjustment control | |
| Ambient light handling | Poor |
One of the key benefits of an OLED panel is the fact it is capable of generating true blacks and a basically infinite contrast ratio. Each pixel can be fully turned off individually, and there’s no need for backlight local dimming here like there is on LCD’s. As a result, the black depth and contrast ratio can surpass all LCD panel technologies including VA panels by a long way. Blacks look inky and deep, and you get local contrast between different areas of an image.
Your ambient lighting may have some impact on perceived contrast ratio as it does with all screens, with this being more of a challenge on QD-OLED panels like that used here, than on competing WOLED alternatives. Most of the 240Hz 27″ OLED screens you will find are built around a WOLED panel actually. On QD-OLED panels in brighter rooms there is a fairly noticeable issue with raised blacks due to the panel structure and the fact that a polarizer is not used. The ambient lighting can cause inadvertent activation of the Quantum Dot layer on those panels, and blacks can start to look more grey or have a purple hue. We studied the impact of this in detail recently, which is linked below if you want to know more. In darker rooms or where you can more carefully control your light sources, it is not a major problem, but competing WOLED panels do fare better in a wide range of viewing conditions.
- Related content: The OLED Black Depth Lie – When Panel Type and Coating Matters
The near black shadow detail was reasonable out of the box in the native colour space mode and we could just make out box 4 in an RGB greyscale test as the first we could distinguish before calibration. This is something that can often be an issue on OLED panels but is seems to be pretty decent here in SDR mode. You can make some tweaks yourself using the ‘Dark Detail’ setting in the menu which works very nicely and adjusts darker grey shades further if you need to without impacting the black depth. There are 3 levels to choose from, and we think these could be useful options for those who want to bring out shadow detail a little more.
Backlight or Panel Flicker

| Flicker | |
| Flicker free verified | |
| PWM / flicker frequency | n/a |
Like other OLED screens there is a minor fluctuation of the backlight, and in this case it operates in sync with the refresh rate, whatever you have that set at. Above it’s operating at 240Hz so there’s a small fluctuation every ~4.17ms. You can see on the graph above that the 0V would be an “off” state, so the amplitude of this fluctuation is minor, and does not produce any visible flickering or anything like that in practice. It’s not the same as PWM on an LCD monitor where the backlight is rapidly switched fully off and on when trying to dim the brightness level. Obviously being an OLED panel there is no backlight here anyway, and this minor fluctuation didn’t cause us any problems in real use and would be considered flicker free.
OLED Care

One challenge with OLED panels in general is the inherent risk of image retention and burn-in. It’s a technology more suited to dynamic and changing content, which is why these are largely positioned as gaming and multimedia screens. There is more of a risk of image retention if you are using these screens for lots of static desktop and office use though. Display manufacturers provide a range of measures to help mitigate that risk, and maintain the panel over time and we will talk about the OLED Care measures in a moment.
| OLED Care and Warranty | |
| Warranty period | 3 years |
| Burn-in cover | |
| Screen saver | |
| Pixel / screen shift | |
| Logo dimming | |
| Taskbar detection | |
| Motion sensor | |
| Other OLED care features | Thermal protection Boundary dimmer |
AOC include a 3 year warranty with the monitor, including burn-in cover which gives some added peace of mind around usage and image retention risks. The screen has a fan-less design, using a custom heatsink and graphene film for cooling.

To help mitigate the risks of image retention, AOC provide a few options in the OSD menu. There’s an ‘Pixel Orbiting’ (aka Pixel shift) function which can shift the image a few pixels at a time when turned on, or it can be disabled if you find that problematic or distracting which is useful. There’s the standard ‘Pixel Refresh’ cleaning cycle, and also a ‘Screen saver’ function that auto-dims the screen when it detects static content (like an ASBL). There’s also a ‘logo protection’ feature, ‘boundary dimmer’ (especially useful if you’re using non-standard aspect ratios and have black bars on the screen), a ‘taskbar dimmer’ and a ‘thermal protection’ setting which would dim the screen is the monitor reaches over 60 degrees in temperature.
This is a comprehensive range of OLED care options which is nice to see included. The only thing missing that we think should be included on more OLED screens is a motion / proximity sensor to turn the screen off when it detects you are no longer using it. That seems like a really obvious thing that could help with OLED screens and save some worry.
Testing Methodology Explained (SDR)

Performance is measured and evaluated with a high degree of accuracy using a range of testing devices and software. The results are carefully selected to provide the most useful and relevant information that can help evaluate the display while filtering out the wide range of information and figures that will be unnecessary. For measurement, we use a UPRtek MK550T spectroradiometer which is particularly accurate for colour gamut and colour spectrum measurements. We also use an X-rite i1 Pro 2 Spectrophotometer and a X-rite i1 Display Pro Plus colorimeter for various measurements. Several other software packages are incorporated including Portrait Displays’ Calman color calibration software – available from Portrait.com.
We measure the screen at default settings (with all ICC profiles deactivated and factory settings used), and any other modes that are of interest such as sRGB emulation presets. We then calibrate and profile the screen before re-measuring the calibrated state.
The results presented can be interpreted as follows:
- Gamma – we aim for 2.2 gamma which is the default for computer monitors in SDR mode. Testing of some modes might be based on a different gamma but we will state that in the commentary if applicable. A graph is provided tracking the 2.2 gamma across different grey shades and ideally the grey line representing the monitor measurements should be horizontal and flat at the 2.2 level, marked by the yellow line. Depending on where the gamma is too low or too high, it can have an impact on the image in certain ways. You can see our gamma explanation graph to help understand that more. Beneath the gamma graph we include the average overall gamma achieved along with the average for dark shades (0 black to 50 grey) and for lighter shades (50 grey to 100 white).
- RGB Balance and colour temperature – the RGB balance graph shows the relative balance between red, green and blue primaries at each grey shade, from 0 (black) to 100 (white). Ideally all 3 lines should be flat at the 100% level which would represent a balanced 6500K average colour temperature for all grey shades. This is the target colour temperature for desktop monitors, popular colour spaces like sRGB and ‘Display DCI-P3’ and is also the temperature of daylight. It is the most common colour temperature for displays, also sometimes referred to as D65. Where the RGB lines deviate from this 100% flat level the image may become too warm or cool, or show a tint towards a certain colour visually. Beneath this RGB balance graph we provide the average correlated colour temperature for all grey shades measured, along with its percentage deviance from the 6500K target. We also provide the white point colour temperature and its deviance from 6500K, as this is particularly important when viewing lots of white background and office content.
- Greyscale dE – this graph tracks the accuracy of each greyscale shade measured from 0 (black) to 100 (white). The accuracy of each grey shade will be impacted by the colour temperature and gamma of the display. The lower the dE the better, with differences of <1 being imperceptible (marked by the green line on the graph), and differences between 1 and 3 being small (below the yellow line). Anything over dE 3 needs correcting and causes more obvious differences in appearance relative to what should be shown. In the table beneath the graph we provide the average dE across all grey shades, as well as the white point dE (important when considering using the screen for lots of white background and office content), and the max greyscale dE as well.
- Luminance, black depth and contrast ratio (static) – measuring the brightness, black depth and resulting contrast ratio of the mode being tested, whether that is at default settings or later after calibration and profiling. We aim for 120 cd/m2 luminance which is the recommended luminance for LCD/OLED desktop monitors in normal lighting conditions. Black depth should be as low as possible, and contrast ratio should be as high as possible.
- Shadow detail – this is evaluated with the screen configured to a 200 nits white luminance for consistency between different monitors, and viewed in a dimly lit room. This first 16 greyscale shades are measured using our UPRTek MK550T spectro device (0.002 nits lower limit) for shades near-black, and the results are plotted on a graph relative to a target gamma curve (usually 2.2 gamma). Where the measurement line crosses the 0.01 nits point on the Y-axis is typically the visual threshold for where we would start to be able to detect luminance compared with black (0.00 nits). We combine these objective measurements with visual tests using a grey shade test pattern to determine the first visible shade, and then rank the shadow detail performance accordingly.
- Gamut coverage – we provide measurements of the screens colour gamut relative to various reference spaces including sRGB, DCI-P3, Adobe RGB and Rec.2020. Coverage is shown in absolute numbers as well as relative, which helps identify where the coverage extends beyond a given reference space. A CIE-1976 chromaticity diagram (which provides improved accuracy compared with older CIE-1931 methods) is included which provides a visual representation of the monitors colour gamut coverage triangle as compared with sRGB, and if appropriate also relative to a wide gamut reference space such as DCI-P3. The reference triangle will be marked on the CIE diagram as well.
- dE colour accuracy – a wide range of colours are tested and the colour accuracy dE measured. We compare these produced colours to the sRGB reference space, and if applicable when measuring a wide gamut screen we also provide the accuracy relative to a specific wide gamut reference such as DCI-P3. An average dE and maximum dE is provided along with an overall screen rating. The lower the dE the better, with differences of <1 being imperceptible (marked by the green area on the graph), and differences between 1 and 3 being small (yellow areas). Anything over dE 3 needs correcting and causes more obvious differences in appearance relative to what should be shown. dE 2000 is used for improved accuracy and providing a better representation of what you would see as a user, compared with older dE methods like dE 1994, as it takes into account the human eye’s perceptual sensitivity to different colours.
Default Setup SDR

The screen comes out of the box with the full ‘Panel Native’ gamut active, offering a vivid and saturated image and colours that some people will like for gaming and multimedia, but may appear too over-saturated for a lot of standard SDR content. We’ll look at the available colour space emulation modes in a moment.
The default gamma in the ‘Gamma1’ mode was excellent, being very close to the 2.2 target across the entire greyscale. The shadow detail was reasonable, with the first visible RGB greyscale box being visible as number 4. The colour temp was a little too warm, getting progressively more so as the grey shade gets lighter, until the highest error was seen at the white point. We measured a 6233K white point which was 4% out from the target and a bit too warm. Not terrible but a little off what we’d ideally like. The screen is set by default in the ‘Warm’ colour temp mode, so this is perhaps to be expected. This results in a fairly large error in the greyscale, especially in lighter grey shades where dE reaches up to 5.7 max.

Thanks to the Quantum Dot coating on the QD-OLED panel, there is a very wide colour gamut offered. This covers ~141.8% of the sRGB reference, extending a considerable way beyond that colour space in red and green shades especially. It also extends a fair way beyond the wide DCI-P3 colour space, resulting in 113.1% relative coverage there. With the very wide gamut in play, and the over-saturation of SDR content, the accuracy of sRGB colours was poor as you would expect with a dE 5.4 average measured. Because the colour space also extends a fair way beyond DCI-P3, the accuracy of those colours was also only ‘moderate’ with dE 3.3 measured.
The native gamut of the panel is well suited to HDR content which requires a wide colour space, typically mastered in either DCI-P3 or in the even wider Rec.2020. It does also offer you the capability to support the Adobe RGB colour space very nicely, often used in the professional and photography market. There is 98.2% absolute coverage measured, but the native gamut extends a long way beyond Adobe RGB and leaves you with 121.6% relative coverage. There is no emulation mode or colour clamp in the OSD menu for that particular colour space, so if you did want to work specifically with Adobe RGB content then you’d need to be able to profile the screen yourself with a calibration device. At least the panel has the colour space overall to nicely support Adobe RGB, but we’d have liked to have seen a provided emulation mode available.
sRGB Emulation Mode
AOC do provide an sRGB emulation mode in the menu, but one immediate issue with this mode is that most of the OSD controls are now unavailable and greyed out. You can thankfully still change the brightness level (allowing for 15 – 224 nits brightness range), but contrast, colour temp, gamma etc are all locked now. We are very much at the mercy of AOC’s configuration here and it’s a shame that these modes continue to be locked down on some monitors and by some brands.

Gamma was overall decent with 2.25 average measured, although it was a bit high in darker grey shades on the left hand side of the gamma graph which resulted in some loss of shadow detail. The first visible greyscale box was RGB 7 now, whereas it was 4 in the Native mode where gamma was a bit more accurate.
Colour temp was a little further from the target in this mode, being slightly more warm than before. We had a 6149K white point which was 5% out from the 6500K target. Without being able to change the colour temp setting or adjust the RGB channels, this cannot be improved without a calibration device and profiling of the screen. It left us with a pretty poor greyscale accuracy with only dE 3.7 measured.

Thankfully this mode does offer a pretty good clamping of the native colour space, now matching sRGB more closely. It doesn’t cut down all the red over-coverage though, and we still had 107.1% relative coverage of sRGB, but it was certainly less saturated than before and much closer to sRGB. With this smaller colour space now active, the accuracy of sRGB / SDR colours was reasonable with dE 2.3 average measured. It’s good to see an sRGB clamp provided, and access to brightness is of course vital, but it’s a shame the rest of this mode is so locked down and restrictive. We’d like to see AOC make these modes more configurable, like some other manufacturers offer on their modern monitors.
DCI-P3 Emulation Mode

The DCI-P3 mode has been configured a bit differently, actually set to a 2.6 gamma which is the target for the ‘DCI-P3 theatre’ standard. You can see that the average gamma measured is 2.66, but there is a lot of deviation across the greyscale. It’s too high in darker grey shades on the left hand side of the gamma graph, and a bit too low in lighter grey shades on the right hand side. The high gamma in dark grey shades crushes shadow detail more than normal for a 2.6 gamma mode which is a shame.
Oddly it doesn’t look like the colour temp is configured to the 6300K target for ‘DCI-P3 theatre’, even though the gamma has been. It’s not green enough in appearance and while the colour temp figure is warm (6166K white point), it’s balanced too much towards red and not towards green like it should be for the DCI-P3 white point. It is basically the same colour temp as we’d seen in the sRGB mode, again suggesting it’s just set to target 6500K like the sRGB mode, but is a little warmer than intended. This is a muddle then between the DCI-P3 theatre standard (2.6 gamma and D63 targets) and the DCI-P3 display standard (2.2 gamma, D65 targets).
Again, the main challenge with this mode is that all of the OSD controls are locked apart from brightness, and so you cannot change the gamma, colour temp, RGB channels or anything else. This is pretty restrictive unfortunately.

There is a good clamping of the DCI-P3 colour space, cutting back most of the 113.1% relative coverage we’d measured in the native mode. There was still a small bit of over-coverage in red shades, and we now had a 104.1% coverage measurement. With the smaller colour space active, more closely matched to DCI-P3 now, the colour accuracy of DCI-P3 colours was improved and we had a reasonable colour accuracy of dE 2.2. While this mode does reduce the colour space a bit and bring it closer to DCI-P3, the locked down settings make it of questionable value.
Calibration


Calibration and profiling can produce some very good overall results and could be useful though if you wanted to operate the screen within its native wide gamut mode, but then map the colour space back to something else like sRGB or Adobe RGB for instance for colour-aware applications (e.g. Photoshop). You would need a suitable calibration device and software.
In this section the screen was profiled to 2.2 gamma, 6500K colour temp and to the sRGB colour space. The screen was left in its native wide gamut mode, but this profile will be used in colour-aware applications to map back to sRGB in this instance. Overall the calibrated results were excellent all round as you’d hope. You can find our calibrated settings and ICC profile in our ICC profile database now.
ICC Profiles and Monitor Calibration Database
Find the recommended settings and a calibrated ICC profile for your display.
[View here]
General and Office

The AG276QZD2 is quite well suited for office work, although caution as ever is advised when it comes to using an OLED panel for lots of static content. The technology carries an inherent risk of image retention and burn-in, and so it’s certainly a screen more suited to dynamic content like gaming and video. Having said that, the panel does pretty well for some office use if you need it to. The 2560 x 1440 resolution is pretty standard on a screen this size. It won’t provide the same sharpness and pixel density as a 4K resolution (not currently available in 27″ OLED size but likely to be released in 2025) but should be perfectly comfortable and fine for most users.
Sub-pixel Layout and Text Rendering
Because of the somewhat unusual triangular shaped RGB sub-pixel layout, slight text fringing has been a challenge on older QD-OLED monitors. This has been improved with the Second Generation and Third Generation panels, including that used here on this display which is using a Gen 3 QD-OLED panel. These panels have a slightly improved subpixel size and shape with more pixel fill than older panels, although still in the triangular RGB layout, but improving text rendering a bit as a result. You get some issues still, it’s not “fixed”, but it feels better in day to day content we think than older panels with their more diamond-shaped sub-pixels. We didn’t really experience any major issues with office and general use, although this will vary by user.
Screen coating
The screen coating of the QD-OLED panel is the standard “semi glossy” finish. It retains most of the clear and crisp picture quality of a fully glossy solution, but without having major reflections to worry about thanks to an added AR (Anti Reflection) film. In certain situations and lighting conditions you will certainly see more reflections than a matte coated screen and light isn’t diffused in the same way, but during typical day to day usage, even with a window facing the screen we didn’t find it too bad at all. The coating can make colours and blacks pop a bit more, in the right lighting conditions. We quite like the coating balance here personally and prefer it to the matte AG coating of WOLED panels at the moment.
- Further reading: Glossy vs Matte – OLED Panel Coatings Compared
Screen Brightness
| Brightness | |
| Maximum brightness (SDR) | 223 nits |
| Minimum brightness | 15 nits |
| Uniform brightness behaviour | |
| Flicker free |
The screens brightness should be adequate for most users, reaching up to around 223 nits maximum in SDR applications and without the need for ABL to be used at all. This is great news as it ensures a consistent and stable brightness no matter the content you view, or no matter your window sizes. The screen can’t reach as bright as a few other modern OLED panels (which reach 270 – 280 nits in some cases), but unless you need to use the screen in a very bright room or are used to running your existing screen at high brightness settings, it should be adequate still. The lower adjustment is decent for darker room environments.
Useful Office Features
| Features | |
| USB type-C connectivity (DP Alt mode) | |
| USB type-C power delivery | |
| KVM switch | |
| PiP and PbP support | |
| USB data ports | |
| Easy access USB data ports | |
| Integrated speakers | 2 x 5W |
| Audio output / headphone out | |
| Mic input | |
| Ambient light sensor | |
| Motion sensor | |
| Stand adjustments | Tilt, height, swivel, rotate |
| Tripod socket | |
| Fan-less design |
The screen has a limited range of additional features and connections in the modern monitor market. There’s unfortunately no USB type-C connection here, or features like a KVM switch that some people might like to use. There are however 2x USB data ports on the back of the screen as well as a headphone connection, and some lower end, but still potentially useful, 2x 5W integrated speakers. The stand also provides a good range of adjustments and PiP/PbP modes are supported if you need them. Cutting back on some of these extras helps keep retail costs of this screen down though so you can’t have everything.
Blue Light and Eye Care Modes

The native panel spectral distribution is shown above at a calibrated 6500K white point, where the blue peak is at 453 nm. This means it is not part of the Eyesafe certified range of products where there is a supposed harmful range between 415 – 455nm.
There is a ‘LowBlue Mode’ setting in the menu with 4 levels available under different preset modes, making the image slightly warmer and more yellow each time. The modes are Multimedia (5972K white point), Internet (5562K), Office (5261K) and Reading (4973K).
Gaming

The AOC AGON PRO AG276QZD2 uses a QD-OLED panel which is well-known for its near-instant response times. As a result it does not need to use overdrive technology in the same way as a desktop LCD panel would, and there aren’t any controls for the response time or overdrive in the OSD menu as they’re not needed. AOC, like other OLED display manufacturers quote a very low 0.03ms G2G response time in their spec, and while true <1ms G2G should be expected from this technology this is a little unrealistic.
| (at native resolution) | Refresh Rate |
| Maximum Refresh Rate DisplayPort | 240Hz |
| Maximum Refresh Rate USB type-C | |
| Maximum Refresh Rate HDMI | 144Hz |
| VRR range | 48 – 144Hz (HDMI) 48 – 240Hz (DisplayPort) |
| ClearMR certification tier | ClearMR 13000 |
The OLED panel provides super-deep blacks and a basically infinite contrast ratio which is of course excellent for gaming too. The per-pixel level dimming and high contrast ratio also make it well suited to HDR gaming, and we will measure HDR performance a bit later. The very wide viewing angles of this technology are also excellent and make the screen suitable for viewing from many different positions if you need. These wide viewing angles importantly include the freedom from things like the pale/white “IPS glow” that you get on darker content on that common LCD technology. There’s none of that here on the OLED panel.
You are of course going to need a powerful system and graphics card to run 1440p at 240Hz though, so keep that in mind. This screen has a lower refresh rate than some other 27″ QD-OLED monitors (which are 360Hz) and so can save you some money if you don’t have a system that can power that high frame rate, if you play slower games with lower frame rates anyway, or you simply aren’t a competitive gamer and maybe don’t need that additional Hz.
You will still need to be a modern card that supports Display Stream Compression (DSC) via DisplayPort to be able to power this combination though so keep that in mind. Note that you need to use DP to reach 240Hz as the HDMI ports are only HDMI 2.0 generation and only support up to 1440p @ 144Hz.
| VRR capabilities and Certification | |
| AMD FreeSync certification | |
| Native NVIDIA G-sync module / G-sync scaler | |
| NVIDIA ‘G-sync Compatible’ certified | |
| VESA ‘AdaptiveSync’ certification | |
| HDMI-VRR (consoles via HDMI 2.1) | |
| OLED VRR Anti-flicker modes |
To help support the 2560 x1440 @ 240Hz the screen features adaptive-sync, giving Variable Refresh Rate (VRR) support for both NVIDIA and AMD systems which is great news. The screen has also been certified under the NVIDIA’s ‘G-sync Compatible’ scheme at this time but is not listed on AMD’s FreeSync monitor list for some reason.
VRR flicker can be a challenge on OLED screens and we experienced some familiar flickering in darker content, triggered especially in situations with large frame rate swings. It’s hard to quantify the level of flicker and whether you might experience it on any OLED screen, as there’s so many variable at play (your system, graphics card, frame rates, game title, scene type etc). There are no anti-flicker modes offered on this screen unfortunately, like we have seen on a few modern gaming OLED monitors.
Gaming Features and Settings
| Other Features | |
| NVIDIA DSR / DLDSR support | |
| Black Frame Insertion (BFI) | |
| Gaming extras | Game preset modes, Shadow control, Dark Boost, Sniper scope, Frame rate counter |
| Emulated gaming sizes | (Not working) |
We tested support for NVIDIA DSR / DLDSR which can sometimes work on monitors with DSC (Display Stream Compression), but not always. We found that these technologies were available on this screen, even though it’s using DSC to power 1440p @ 240Hz 10-bit. There is no option to disable DSC in the menu, not that you need to for these technologies as they work natively anyway. Sadly there is no BFI (Black Frame Insertion) blur reduction mode on this screen, something only offered so far on Asus’ gaming OLED screens to help improve motion clarity in certain situations.
There are a range of gaming extras in the menu including various preset modes via ‘Game Mode’ menu. There is also Shadow control, Game Color, Sniper Scope and a Frame Counter. The Shadow control setting makes some stepped changes to the image and greyscale, but raises blacks at the same time so it is not advisable to set this too high we don’t think. The separate Dark Boost setting in the ‘luminance’ menu is better with levels of 1 – 3 available, and that doesn’t raise blacks in the same way. Game Color has a default setting of 10, with options to go from 0 – 20 to boost or reduce vividness of colours if you want. Keep in mind that this setting would impact accuracy.
There are also a very wide range of aspect ratio modes listed in the user manual for this screen but we could not seem to get access to them at all – they were always greyed out in our testing, even when disabling VRR which often blocks these kind of modes on AOC monitors we’ve tested before, and when we were using “odd” resolution inputs. According to the user manual there should be options for Wide, Aspect, 4:3 and 1:1 pixel mapping. Then options to simulate various specific screen sizes like 17″(4:3), 19″(4:3), 19″(5:4), 19″W(16:10), 21.5″W(16:9), 22″W(16:10), 23″W(16:9), 23.6″W(16:9) and 24″W(16:9). It’s weird that these seem to always be locked in the OSD menu, perhaps they are not yet available in the current firmware as they appeared to simply not work.
Response Times
As discussed in our detailed article about Response Time Testing – Pitfalls, Improvements and Updating Our Methodology we are using an improved and more accurate method for capturing G2G response times and overshoot, based on figures that are more reflective to what you see visually on the screen in real-World usage. Our article linked above talks through why this is better and how we arrived at this improved method in much more detail.

The above G2G response times are consistent at all refresh rates, including 240Hz, 120Hz and 60Hz and during VRR situations with changing frame rates. Thanks to the OLED panel the response times are super-fast and near-instant, with an average of only 0.50ms G2G measured. The best case was an incredibly impressive 0.34ms and the overall response times were as expected from an OLED panel. All transitions can keep up easily with the frame rate demands of 240Hz. There was also no overshoot visible at all which was excellent news.
Our thanks to the following manufacturers for support in the build of our new test system:
| AMD Ryzen 9 7950X | Buy AMD Ryzen 9 CPUs here on Amazon | |
| Asus ProArt B650-Creator | Buy Asus B650 motherboards here on Amazon | |
| Corsair DDR5 RAM | Buy here on Amazon | |
| Corsair H100i Elite Capellix AIO cooler | Buy Corsair coolers here on Amazon | |
| Corsair iCUE RGB Elite Fans | Buy here on Amazon | |
| NVIDIA RTX 3090 | Buy NVIDIA RTX graphics cards here on Amazon |
| We may earn a commission if you purchase from our affiliate links in this content – TFTCentral is a participant in the Amazon Services LLC Associates Programme, an affiliate advertising programme designed to provide a means for sites to earn advertising fees by advertising and linking to Amazon.com, Amazon.co.uk, Amazon.de, Amazon.ca and other Amazon stores worldwide. We also participate in a similar scheme for Overclockers.co.uk, Newegg, Bestbuy and some manufacturers. |
Motion Clarity
We captured some pursuit camera photos of the screen at a variety of refresh rates, designed to capture real-world perceived motion clarity. This gives you a good indication of how the screen looks in real use, beyond G2G response time measurements.

The motion clarity is as expected from a 240Hz OLED monitor, and all OLED screens of this refresh rate look visibly the same. Motion clarity is very good at 240Hz on these kind of panels, actually equivalent to a good 360Hz LCD monitor in practice.

Here’s some further comparisons of the motion clarity with other common OLED refresh rates, including the alternative 360Hz QD-OLED panels which are currently available in 27″ screen size at the moment like the MSI MPG 271QRX and Dell Alienware AW2725DF; and the new 480Hz 27″ WOLED panels like the Asus ROG Swift PG27AQDP.
The motion clarity is improved further as you move from 240Hz up to 360Hz, and then a little more as you move up to 480Hz, although to benefit from this you’re going to have to be able to power very high frame rates from your system. This screen obviously obvious has a limit of 240Hz and is aimed more at gamers who don’t necessarily need or want those super top-end specs. It’s still a very impressive gaming experience at 240Hz on an OLED with great motion clarity.
Lag
Read our detailed article about input lag and the various measurement techniques which are used to evaluate this aspect of a display. The screens tested are split into two measurements which are based on our overall display lag tests and half the average G2G response time, as measured by our oscilloscope. The response time element, part of the lag you can see, is split from the overall display lag and shown on the graph as the green bar. From there, the signal processing (red bar) can be provided as a good estimation of the lag you would feel from the display. We also classify each display as follows:
Lag Classification (updated)
- Class 1) Less than 4.17ms – the equivalent to 1 frame lag of a display at 240Hz refresh rate – should be fine for gamers, even at high levels
- Class 2) A lag of 4.17 – 8.33ms – the equivalent of one to two frames at a 240Hz refresh rate – moderate lag but should be fine for many gamers. Caution advised for serious gaming
- Class 3) A lag of more than 8.33ms – the equivalent of more than 2 frames at a refresh rate of 240Hz, or 1 frame at 120Hz – Some noticeable lag in daily usage, not suitable for high end gaming


There is a very low lag on the AG276QZD2 measured at only 0.10 ms total display lag, and once the very fast pixel response times are accounted for that leaves us with basically 0ms of estimated signal processing lag. This is excellent and of course it’s perfectly fine for competitive gaming. This is a lot higher at 60Hz refresh rate, measured at 15.70 ms total display lag. Remember that it is the lower number (0.10ms) that will be relevant for VRR gaming as well, even where frame rates drop. The 60Hz figure is only applicable for fixed 60Hz input sources.
Console Gaming
The screen features offers a 2560 x 1440 native resolution but includes support for ‘Virtual 4K’ input to try and help accommodate modern games consoles like the Xbox Series X and PlayStation 5. AOC have included two HDMI ports, but these are limited in bandwidth and capabilities as they are only HDMI 2.0.
The support for Virtual 4K means you can make use of HDR from the Xbox where that mode is only available at 4K, although because the ports are only HDMI 2.0 bandwidth this only supports 60Hz maximum. At least you can set the Xbox to a 4K 60Hz output which then allows you to use HDR, which is of course one of the key capabilities of this screen. The OLED panel with its amazing contrast and blacks comes in to its own here for HDR gaming, providing an excellent image quality and HDR experience. More on HDR in a moment.
| Console Gaming | |
| Native panel resolution | 2560 x 1440 |
| Maximum resolution and refresh rate supported | 4K @ 60Hz 1440p @ 120Hz |
| Virtual 4K support | |
| 4K at 24Hz support | |
| 4K at 50Hz support | |
| HDMI connection version | 2.0 |
| HDMI-CEC auto switch | |
| FreeSync over HDMI | |
| Auto Low Latency Mode (ALLM) | |
| HDR10 support | |
| Dolby Vision HDR support | |
| Integrated speakers | |
| Headphone connection | |
| Ultra high speed HDMI 2.1 cable provided | |
There is support for 4K 50Hz but not 4K 24Hz though. The screen can support FreeSync over HDMI from an Xbox Series X that supports that, but it won’t work for VRR from a PS5 we believe, since that console does not support this type of VRR. We don’t have a PS5 to be able to sanity check that, so let us know if you have this screen and find otherwise from a PS5. The integrated speakers and headphone connection could be useful for those who want to connect a console to this display, and it’s nice to see those included, albeit they are of limited power on this screen. Better than nothing though for simple console connectivity.
HDR

Being a QD-OLED panel, the AG276QZD2 is well equipped to handle HDR content with its per-pixel level dimming allowing for true blacks, a basically infinite contrast ratio and the avoidance of all blooming and halos. In these regards it can easily surpass any Mini LED backlit LCD monitor. However, it cannot reach the same luminance levels as Mini LED screens, and carries a “peak brightness” spec of 1000 nits, which will then also lower as the content on your screen changes and the APL increases which is normal on this technology. This is one key area where Mini LED screens can look brighter and deliver a more impactful HDR experience.
As it uses a QD-OLED panel it can suffer from the reduced perceived black depth and contrast that are a challenge for this technology. You need to be mindful of your ambient light levels and the position of those light sources. Ideally the light sources would be behind the panel, or you’d be viewing HDR content in a very dark room. That will also help minimise glare and reflections on the screen’s semi-glossy coating.
HDR Demo and Test Video
Test and demo the HDR on your display using our handy compilation, highlighting black depth, contrast and peak brightness capabilities.
[View here]
HDR modes and Settings
The AG276QZD2 has various HDR modes available to select in the menu within the ‘luminance’ section. You can choose between ‘DisplayHDR’, HDR Peak, HDR Picture, HDR Movie and HDR Game modes. The other settings within the ‘luminance’ menu other than the option to switch between the HDR modes, and the entire ‘Color Setup’ menu are unavailable in all of the HDR modes so there is no other configuration possible really. We will test each of these modes and compare their performance.
HDR Testing Methodology Explained
Performance is measured and evaluated with a high degree of accuracy using a range of testing devices and software. The results are carefully selected to provide the most useful and relevant information that can help evaluate the display while filtering out the wide range of information and figures that will be unnecessary. For measurement, we use a UPRtek MK550T spectroradiometer which is particularly accurate for colour gamut and colour spectrum measurements. We also use an X-rite i1 Pro 2 Spectrophotometer and a X-rite i1 Display Pro Plus colorimeter for various measurements. Several other software packages are incorporated including Portrait Displays’ Calman color calibration software – available from Portrait.com.
We measure the screen at default settings (with all ICC profiles deactivated and factory settings used). The results presented can be interpreted as follows:
HDR accuracy section
- Greyscale dE – this graph tracks the accuracy of each greyscale shade measured from 0 (black) to 100 (white). The accuracy of each grey shade will be impacted by the colour temperature and gamma of the display. The lower the dE the better, with differences of <1 being imperceptible (marked by the green line on the graph), and differences between 1 and 3 being small (below the yellow line). Anything over dE 3 needs correcting and causes more obvious differences in appearance relative to what should be shown. In the table beneath the graph we provide the average dE across all grey shades, as well as the white point dE (important when considering using the screen for lots of white background and office content), and the max greyscale dE as well.
- RGB Balance and colour temperature – the RGB balance graph shows the relative balance between red, green and blue primaries at each grey shade, from 0 (black) to 100 (white). Ideally all 3 lines should be flat at the 100% level which would represent a balanced 6500k average colour temperature for all grey shades. This is the target colour temperature for desktop monitors, popular colour spaces like sRGB and ‘Display DCI-P3’ and is also the temperature of daylight. It is the most common colour temperature for displays, also sometimes referred to as D65. Where the RGB lines deviate from this 100% flat level the image may become too warm or cool. Beneath this RGB balance graph we provide the average correlated colour temperature for all grey shades measured, along with its percentage deviance from the 6500k target. We also provide the white point colour temperature and its deviance from 6500k, as this is particularly important when viewing lots of white background and office content.
- ST 2084 EOTF (PQ) tracking – this graph tracks the PQ curve in HDR mode, akin to gamma measurements in SDR. The yellow line represents the ideal PQ curve, while the grey line plots the monitors measured performance.
- Luminance, black depth and contrast ratio (top right hand table) – measuring the brightness, black depth and resulting contrast ratio of the mode being tested. The luminance figure captured here is from a standard 10% APL window area measurement, although further luminance measurements are included in a separate section to capture “peak brightness” and the luminance at other APL areas. This section also measures the black depth on the screen and the resulting contrast ratio.
For HDR, any local dimming is left enabled, and so we measure the black depth adjacent to a white test image and calculate the “local contrast ratio” from there. We also measure the black depth towards the edges of the screen, away from the white test area in order to calculate the “maximum full frame contrast ratio” across the whole panel. These figures will often be different on LCD screens with local dimming, as this dimming can be more effective for dark areas further away from light areas.
HDR colours section
- Gamut coverage (2D) – we provide measurements of the screens colour gamut for HDR relative to the very wide Rec.2020 colour space. Coverage is shown in absolute numbers as well as relative, which helps identify where the coverage extends beyond a given reference space. A CIE-1976 chromaticity diagram (which provides improved accuracy compared with older CIE-1931 methods) is included which provides a visual representation of the monitors 2D colour gamut coverage triangle as compared with Rec.2020. The higher the coverage, the better.
- dE colour accuracy – a wide range of Rec.2020 colours are tested and the colour accuracy dE measured. An average dE and maximum dE is provided along with an overall screen rating. These numbers are calculated based on the colour tone and hue, and ignore any luminance error. The lower the dE the better, with differences of <1 being imperceptible (marked by the green area on the graph), and differences between 1 and 3 being small (yellow areas). Anything over dE 3 needs correcting and causes more obvious differences in appearance relative to what should be shown. dE 2000 is used for improved accuracy and providing a better representation of what you would see as a user, compared with older dE methods like dE 1994, as it takes into account the human eye’s perceptual sensitivity to different colours.
HDR Testing
PQ EOTF Tracking and Greyscale
Click between each tab to see results and analysis for each of the HDR modes


There are three main modes to consider here. The ‘DisplayHDR’ mode should be fairly familiar to anyone who’s read a review of any recent OLED monitor and is akin to the common ‘True Black 400’ modes you will see on other OLED monitors. This mode is certified under the VESA ‘DisplayHDR 400 True Black’ scheme, and is expected to offer the more accurate EOTF tracking, but be limited in its peak brightness capability. Our testing showed pretty good tracking of the PQ EOTF overall in this mode, although it was a little darker than intended in darker grey shades near black, where on the right hand graph the grey line representing the monitor measurements dips a little below the target yellow line. Shadow detail is a little crushed as a result, with the first visible RGB greyscale shade being visible as number 8 (using proper HDR test patterns, not SDR tests within HDR mode).
If you switch to the ‘HDR Peak’ mode you can see the EOTF tracking is a little further off, now being a bit darker than intended across most of the greyscale, and dipping even further than intended in dark grey shades. This crushes shadow detail a bit further unfortunately, with the first visible greyscale shade being RGB 10. This mode is akin to the common ‘Peak 1000’ modes you will see on other OLED screens, and should reach higher peak luminance values but will likely look overall darker than the ‘DisplayHDR’ mode. We’ll examine brightness more later.
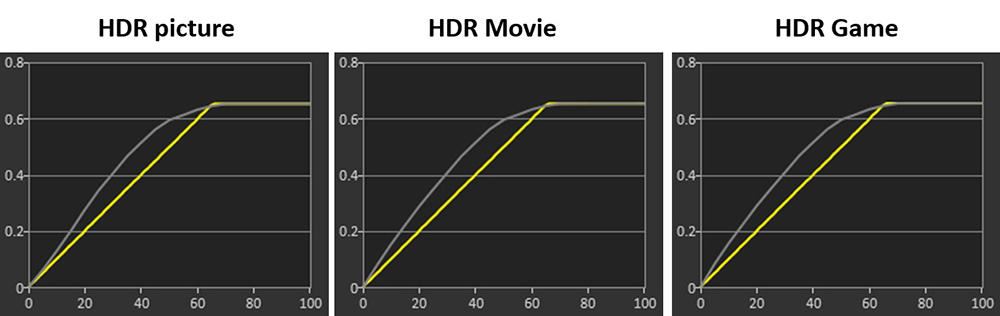
The HDR Picture mode is significantly different and is actually a lot brighter than intended, a tactic we’ve seen on several OLED monitors now to try and avoid too much dimming as the image APL changes, and produce an overall brighter HDR experience. We will examine luminance and brightness more in a moment, but you can see that the EOTF tracking in this HDR Picture mode is much higher than intended. This results in some crushing of lighter grey shades in practice, but does produce an overall brighter image in HDR. More on that in a moment.
The HDR Movie and HDR Game modes behave very similarly to the HDR Picture mode overall, with only minor adjustments to the EOTF tracking in darker grey shades, making them a little brighter. These are very minor differences so we won’t provide full results and data for those other modes. Visually those 3 all look very similar, so pick whichever one you want if you decide you want to use these brighter modes. Shadow detail is improved a bit in these modes compared to the other two modes discussed, with RGB 5 being the first visible greyscale box.
All 5 of the modes are very similar in terms of colour temp and white point by the way, being a bit too warm overall with a 7 – 8% error in the greyscale average and a 5 – 6% error for the white point. There’s no access to other colour temp or RGB settings in HDR mode, so you will have to live with a slightly too warm setup.
Colour Accuracy
Click between each tab to see results and analysis for each of the HDR modes


There was very little difference between the 3 modes when it came to colour accuracy for HDR content. It dropped a little bit in the ‘HDR Picture’ mode, but not by anything major. The HDR Movie and HDR Game modes behaved the same as the Picture mode.
One interesting observation is that all of these HDR modes seem to clamp the colour space back from the native gamut, to somewhere close to DCI-P3. As a result it’s not taking full advantage of the available gamut in HDR for any content that might be mastered beyond DCI-P3, as some may be mastered in the wider Rec.2020 colour space. The panel can natively cover 82.3% of Rec.2020 and we measured that in SDR mode previously. But in HDR mode, even when inputting Rec.2020 test patterns, the colour space was restricted to ~DCI-P3 which is around 73% Rec.2020. This isn’t a problem for DCI-P3 content of course.
HDR Brightness
Peak White Luminance

The common peak white luminance measurements are included here. As is usual for these OLED monitors the DisplayHDR mode (akin to a True Black 400 mode) is capped at a low brightness, reaching only 408 nits maximum in our measurements. The ‘HDR Peak’ mode reached higher white luminance for the smallest APL % at 875 nits and the HDR Picture (and Movie, Game) modes showed some slight further increases, now reaching 910 nits maximum. This was a little shy of the advertised spec for smaller APL scenes of 1000 nits though. White luminance values only tell a small part of the story though of HDR brightness.
Luminance Accuracy
To consider the “luminance accuracy” further of the HDR modes we need to consider the EOTF and luminance performance at a range of different APL’s. Our recent investigation of OLED HDR brightness has revealed that we can’t just rely on a single 10% APL measurement any more. If you’re unfamiliar with the testing and data in this section, you can expand the section below for more information.
Luminance Accuracy – Testing and Data Explanation

Let’s just explain the EOTF graphs a little further here before we consider the luminance accuracy of this screen further. In the left hand image above you have an EOTF graph tracking the PQ curve for HDR. Along the horizontal X-axis you have the greyscale from 0 (black), through different shades of grey which get progressively lighter, to 100 (white). The vertical Y-axis is the PQ value, but basically you can think of this a bit like luminance. As you move up the value the screen has a higher luminance. This graph is just a logarithmic conversion of what an actual luminance graph would look like, which is included on the right. You can see the same greyscale 0 > 100 along the bottom but the vertical Y-axis is now luminance measurements directly.
The problem with the luminance graph is that the line is very flat until about greyscale 20 when it then starts to rise on the curve, even though visually you can identify differences in the image for those darker grey shades. In fact small differences in dark shades are more discernible by the human eye than the same differences in lighter shades. The curved graph is harder to read and compare which is why it’s converted to the PQ EOTF graph typically instead. Both graphs are measuring the same thing, but they’re presenting the data in a different way. The EOTF graph on the left is easier to identify where there are errors in not only the lighter shades, but also in the darker shades.
One other thing to note it that you will see in both cases when the lines reach greyscale value 70 (light grey) the yellow target line flattens out completely which would mean that if this is followed exactly by the monitor, all those grey shades from 70 to 100 should actually have the same luminance, and would therefore look the same. Those lightest grey shades get clipped and lost and become white basically. This is how it’s defined in the HDR PQ standard but it is down to the display manufacturer to determine the “roll-off” point. Often you will see the luminance drop a little lower and more gradually level off rather than take such a sharp turn at greyscale 70. That can then help preserve lighter grey tonal values. This is especially useful in situations where the peak luminance of white is lower, like for instance on OLED screens where the APL is high.
Think of it this way – for small 1% APL you might have a full luminance range of 0 – 1000 nits to play with on an OLED monitor, and so clipping light grey shades above greyscale 70 isn’t a major problem as they will be very bright at that point (nearing 1000 nits) and it’s going to be very hard to tell them apart anyway. For a large 100% APL the screen might only be able to reach perhaps 250 nits peak white and now you have a much smaller 0 – 250 nits range to play with. The display manufacturer might choose to clip the grey shades later on by rolling off the luminance more gradually since it’s going to be easier to tell the differences between those lighter grey shades when white is reaching only a much lower 250 nits peak.
Example Data Tables and Graphs – NOT from the screen in this review


To consider the “luminance accuracy” further of the HDR modes we need to consider the EOTF and luminance performance at a range of different APL’s. Our investigation of OLED HDR brightness has revealed that we can’t just rely on a single 10% APL measurement any more.
As well as providing some EOTF graphs at a few different APL’s beyond just the typical 10% APL measurement, we’ve been working on a useful way to measure and represent what we call the “luminance accuracy” of the HDR modes. The tables above are a simple approach which tracks the luminance error. Each grey shade being measured is shown across the top of the table starting from 0 for black, and going through the grey shades until you reach 100 for white. Measurements are taken at a range of different APLs shown down the left hand side, from 1% up to 100% and the measured luminance of each grey shade is compared with the target it should be reaching.
The difference in luminance, whether that’s a positive number where it’s brighter than intended, or a negative number where it’s darker than intended is then captured in the table and colour coordinated. The blue areas are where the luminance is higher, and the pink areas are where it is lower. Ideally for a fully accurate greyscale performance all these squares would be white, which would reflect the ability to achieve the intended luminance for all the different grey shades, and at all the different APL areas. Having said that, as we said earlier it is quite common to have a gentler roll-off for luminance on the higher APL situations, as the absolute peak luminance that can be reached is much lower than at small APL levels, and rolling off a bit earlier helps preserve some light grey details. As a result, some pink-coloured error for larger APL’s in the mid to light grey shades is perfectly acceptable which is what is shown in this example. Some example EOTF graphs are also provided at 10%, 50% and 100% APL.
Example Graph – NOT from the screen in this review

Another good way to represent the luminance is on the above graphs. Here we have considered an average of the measurements across the mid to light grey shades between values 45 and 75, and you can see a visual representation of which shades that covers with the gradient bar under the table on the left. This basically excludes the much darker shades, and also those that are near white, and often where clipping then occurs on OLED screens since they can’t get anywhere near the 10,000 nits upper limited defined for the PQ EOTF. These grey shades from 45 – 75 are the interesting area in terms of where problems arise in real-world brightness, and which will make up a significant portion of any brighter real-world HDR content areas.
On the graph itself the dotted grey line shows the average target luminance that should be reached for those grey shades, while the pale blue line tracks the average measured luminance. Ideally these lines would match if there was no error in the luminance and it was completely accurate. You can see here that for the smallest APL’s the lines meet closely and the achieved luminance is as intended for the different grey shades. In this example, it reaffirms what is shown in the pink/blue tables earlier.


Measuring the luminance accuracy reaffirms the observations we’d made earlier when looking only at the standard 10% APL measurements. The DisplayHDR mode provides the most accurate EOTF tracking at all APL window sizes, with the grey measurement line very closely tracking the yellow target line. It’s a little darker than intended for dark grey shades but this is only slight. As the APL increases, the roll-off point shifts a little to help preserve tonal values, as overall the screen can’t reach as bright now. That’s normal and acceptable behaviour and it’s not too drastic here. The issue of course with this mode is that peak brightness is very limited at only 408 nits max white luminance which is low.
AOC then offer two different approaches to brightness if you want to push the peak white luminance beyond that, and up towards the advertised 1000 nits. The ‘HDR Peak’ mode has a lower brightness than intended and a far more drastic roll-off as the APL increase. You can see the large number of pink values in the luminance table, showing that the mid to light grey shades are a lot darker than is intended by the EOTF. This has the impact of making the ‘HDR Peak’ mode look darker overall than the DisplayHDR mode in practice, despite the ability for it to reach a higher peak white luminance figure for small APL areas (875 nits). This is very similar behaviour to what we see on other QD-OLED monitors where the ‘Peak 1000’ modes end up looking visually darker than the ‘True Black 400’ modes in real content and real use.
AOC have also provided another approach to the “Peak 1000” modes via the ‘HDR Picture’ mode (and the very similar Movie and Game modes). Like we’ve seen on some other QD-OLED monitors, this mode has higher brightness than intended for most grey shades, including darker grey and light grey. This is more apparent for the smaller APL areas less than 50% area before the light grey shades start to become more accurate for the larger APL areas. This mode looks overall brighter than the other two modes, especially for small highlights where it can push up to the higher peak luminance than the ‘DisplayHDR’ mode.
Greyscale Luminance

Above you can see the average greyscale luminance of the 3 modes compared. The HDR Picture (and Movie / Game) mode is brighter than the DisplayHDR mode overall in actual greyscale luminance for lower APL below about 25%, where the full capability of the panel is realised. For larger APL the greyscale luminance is basically the same between the two modes. The ‘HDR Peak’ mode is overall darker than the other modes though in real content, due to the more aggressive ABL dimming and the darker-than-intended EOTF. We expect most people to prefer to use the HDR Picture, Movie or Game mode for a brighter, more impactful overall HDR experience.
Conclusion
Let’s talk a bit about the price point first, as the AOC AGON PRO AG276QZD2 retails for an extremely competitive price of $499.99 USD at the time of writing. You can check latest pricing and availability for your region using the links below. This is a very attractive price point for an OLED monitor, it’s about $250 – 300 less than competing popular 27″ models like the Asus ROG Swift PG27AQDM (240Hz WOLED), MSI MPG 271QRX (360Hz QD-OLED) and Dell Alienware AW2725DF (360Hz QD-OLED) for instance. Sure, you can find other low-cost 27″ OLED options, but that’s a decent saving from a reputable and well-established brand like AOC. It’s nice to have a 240Hz refresh rate option with a QD-OLED panel too, as so far all the other 240Hz OLED’s of this size have been WOLED. Some people may prefer the glossier screen coating and excellent image clarity, as well as the generally better text rendering compared with the 240Hz WOLED options.
| Where to Buy |
| — |
| — |
By using a lower refresh rate panel AOC are offering an interesting QD-OLED option in the 27″ size. Not everyone wants or needs the super-high refresh rates available on some models, including the range of 360Hz QD-OLED models in this size. The screen does cut back on a few features that competing models might offer – there’s no USB type-C, KVM switch or HDMI 2.1 here sadly. There are still a decent range of features including USB data ports, some integrated speakers and support for PiP/PbP modes so it’s certainly not a no-frills option. You’ll need to consider which of those are important to you or not.
From a performance point of view the screen was largely good with excellent gaming performance, response times, motion clarity and lag. It performs as you’d hope for a 240Hz OLED panel for these purposes. Even NVIDIA DSR and DLDSR work without issue despite DSC being used. Console support was a little restricted due to the use of HDMI 2.0 ports instead of 2.1, which was a bit of a shame and this makes it more suited to PC gaming overall.
There’s a good range of OLED care features and it’s great to see AOC offer a 3-year warranty that includes burn-in cover. The default setup was good overall, although colour temp was a bit warm. The panel provides a colour space large enough to offer good support for sRGB, DCI-P3 and Adobe RGB content if you need, although you’ll want a calibration device of your own to use the screen accurately for DCI-P3 and Adobe RGB content. The sRGB emulation mode is thankfully good overall, although a bit warm again. You still have access to brightness control thankfully, but we’d like to see AOC open up the other OSD settings in these emulation modes instead of locking everything down. SDR brightness was a little limited at the upper end compared with most OLED screens too.
HDR offered a choice of modes that mirror the approach on many other QD-OLED monitors so there’s flexibility to find a mode that suits you. The HDR Picture/Movie/Game modes are probably going to be preferrable for most people for a brighter HDR experience. All these modes are a little warm again like SDR, and they don’t quite reach the 1000 nits peak brightness the panel is capable of.
For the price point it’s definitely worth considering the AG276QZD2 if you’re after a new OLED screen that won’t break the bank. If you are perfectly happy with the lower refresh rate and the provided feature set, this could be an excellent choice.
🔷 For a recent round-up of AOC’s OLED monitor range, with options and sizes to suit a wide range of user needs, check out our article here.

| Pros | Cons |
| Very attractive price point for a 27″ OLED panel | SDR emulation modes are inflexible and need improvement |
| Excellent PC gaming experience, motion clarity and lag | More limited brightness in SDR than many other OLED screens |
| Nice to have a QD-OLED panel option with 240Hz refresh rate in this size, with glossier screen coating | Missing some modern features, most notably USB-C and HDMI 2.1 ports |
We may earn a commission if you purchase from our affiliate links in this article- TFTCentral is a participant in the Amazon Services LLC Associates Programme, an affiliate advertising programme designed to provide a means for sites to earn advertising fees by advertising and linking to Amazon.com, Amazon.co.uk, Amazon.de, Amazon.ca and other Amazon stores worldwide. We also participate in a similar scheme for Overclockers.co.uk, Newegg, Bestbuy , B&H and some manufacturers.