Asus ROG Swift PG35VQ
Introduction
Do good things come to those who wait? We hope so, as we’ve got with us now the eagerly anticipated Asus ROG Swift PG35VQ display. It’s been another massive build-up and very long wait for the latest cutting edge technology, and we’ve got exclusive first access in the EMEA region to a sample. The PG35VQ was originally announced over 2 years ago, back in May 2017, and it’s only just starting to appear for general sale in key regions like the USA and Europe. There’s been a lot of hype surrounding this screen because of some of its top end features and specs.
The PG35VQ is designed as a very high-end gaming screen and is 35″ in size with a 21:9 ultrawide aspect ratio and a 1800R screen curvature. It’s based on a 3440 x 1440 resolution VA panel which as a technology is known for its strong black depths and contrast ratios. The key focus of the display is gaming, and it can offer a high refresh rate of 200Hz along with support for NVIDIA G-sync variable refresh rates. In fact the PG35VQ is one of the few “G-sync Ultimate” certified screens on the market. There’s a wide range of added gaming features and settings provided to optimise your experience. It’s the first screen of this type to be released that can offer a high 3440 x 1440 resolution along with such a high refresh rate, making it an attractive option for gamers. Current ultrawide alternatives offer only 144Hz max, most being 100 – 120Hz so the increased potential here is significant.
The other key feature of this screen is it’s 512-zone Full Array Local Dimming (FALD) backlight which can offer superior levels of local dimming control for HDR (High Dynamic Range) gaming and content. This allows for high-end HDR capabilities from current desktop monitor technology, and gives rise to a 1000 cd/m2 peak brightness and certification under the VESA DisplayHDR 1000 standard.
We reviewed the ROG Swift PG27UQ back in August 2018 last year which was a smaller 27″ model offering similar specs and features. That was one of the first screens with a 3840 x 2160 “4K” resolution and 144Hz refresh rate, along with a FALD HDR backlight. The PG35VQ is the ultrawide equivalent, the big brother to the PG27UQ really, with a different panel technology, and different resolution/refresh rate combination.
If you would like to help support our continued work please consider making a donation no matter how small or large. Thank you.
| Check Availability and Pricing – Affiliate Links |
|---|
| Amazon |
| TFTCentral is a participant in the Amazon Services LLC Associates Programme, an affiliate advertising programme designed to provide a means for sites to earn advertising fees by advertising and linking to Amazon.com, Amazon.co.uk, Amazon.de, Amazon.ca and other Amazon stores worldwide. We also participate in a similar scheme for Overclockers.co.uk. |
Specifications and Features
The following table gives detailed information about the specs of the screen as advertised:

The PG35VQ offers a limited range of modern connectivity due to the use of a hardware G-sync module (v2). Only 1x DisplayPort 1.4 and 1 x HDMI 2.0 are offered for video connections. For PC connectivity the DisplayPort is the most common option, with HDMI being available then for connecting external games consoles or Blu-ray players potentially. You will need to use the DisplayPort input for NVIDIA variable refresh rates, as well as to support the bandwidth needed to reach up to 200Hz refresh rate.
The screen has an external power supply and comes packaged with the power cable and rather large brick you need. A headphone output connection is provided as well for audio pass-through (see notes below about this), but there are no integrated stereo speakers on this model. There are also a couple of USB 3.0 ports located on the back of the screen.
Below is a summary of the features and connections of the screen.


| ESS Saber ES9118 Hi-Fi headphone AMP The ESS Saber headphone amplifier acts as a dedicated sound device that can be used via USB input or DP/HDMI. Since not everyone has a PC sat on their desk, integrating a dedicated sound processor into the monitor gives the convenience of 3.5mm jack in arms reach, while also ensuring excellent audio and a high quality headphone amp that integrated motherboard audio often doesn’t provide. Simply selecting the DP/HDMI option offers the all-in-one convenience of a single cable for display and sound (16bit/48KHz), however wiring the USB cable between PC and the upstream port on the monitor provides the benefit of high resolution audio support (24bit/192KHz). To activate this feature, press the Sound Hotkey on the monitor, and choose between USB or the HDMI/DP path. The ES9118 SABRE HiFi AMP integrates ESS’s award-winning DAC technology with its proprietary ESS headphone amplifier. It can deliver up to 125 dB SNR and -112 dB Total Harmonic Distortion plus Noise (THD+N), ensuring audiophile quality sound all the way to the headphones. By integrating ESS audio building blocks, including the DAC, headphone amplifier, feedback resistors, and output switch into a single package, the ES9118 keeps audio processing isolated from the rest of the system, maximizing quality. |
Design and Ergonomics
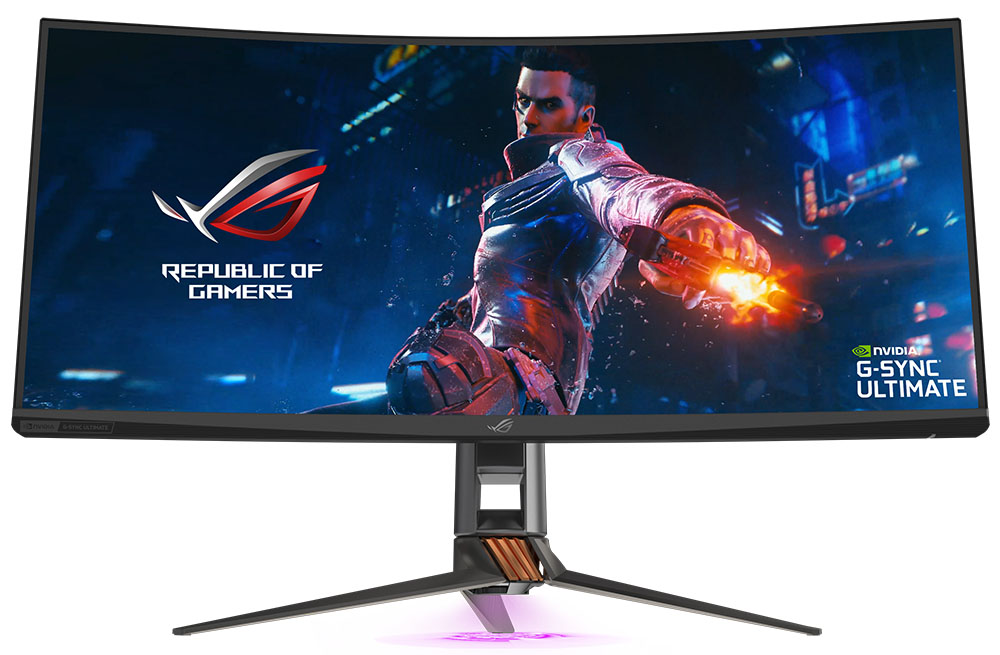
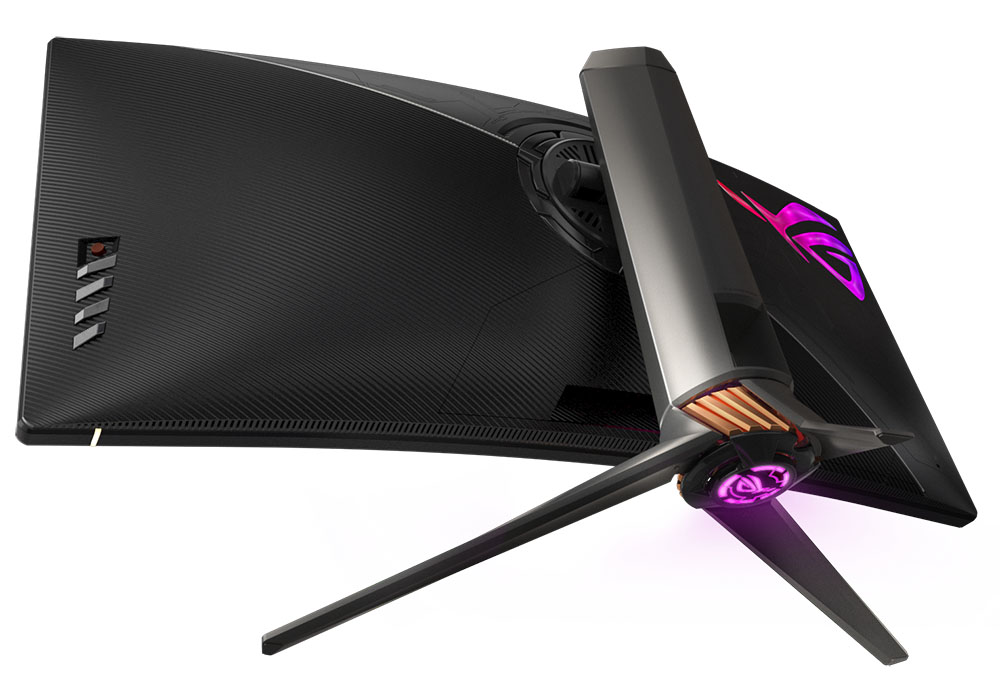
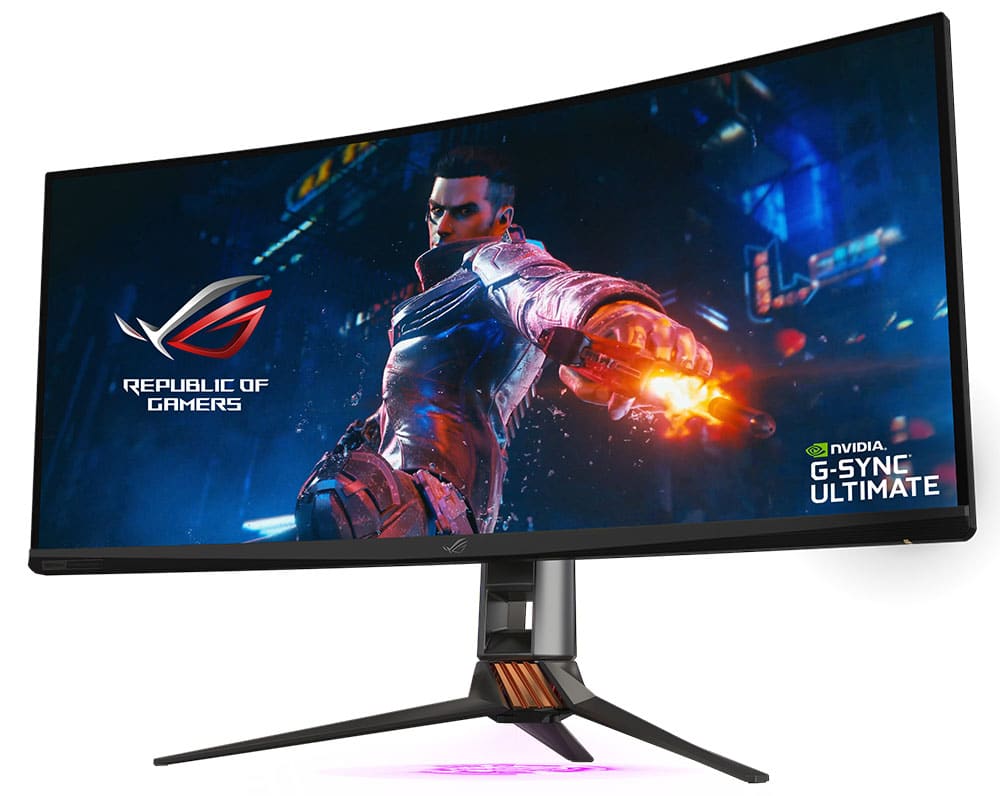
The ROG Swift PG35VQ comes in a black and dark silver design, with some copper coloured sections on the stand. There is a 3-side borderless design with thin 2mm plastic edges along the sides and top of the screen. There is also a 7mm thick black panel border before the image starts, giving a nice thin edge of ~9mm total. Along the bottom edge is a thicker matte black plastic bezel measuring ~20mm thickness. There is a shiny silver ROG logo in the middle, and a light matte silver “NVIDIA G-sync Ultimate” logo on the bottom left hand corner. The power LED strip is situations on the bottom edge on the right hand side and so is out of sight from a normal viewing position.
The stand has a darker silver plastic trim for the arm, and a dark silver aluminium 3-pronged foot. There is a small copper section in the base as you can see from the images provided. The stand attaches in to the middle of the screen but can be removed to reveal a VESA 100mm mounting option if you wish.
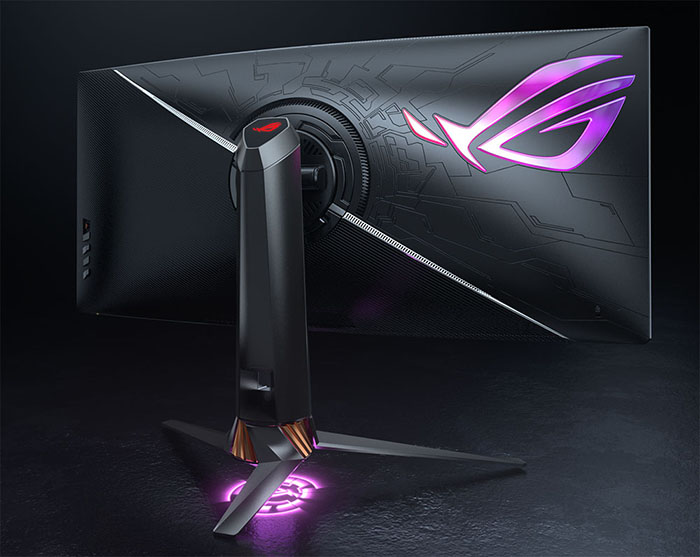
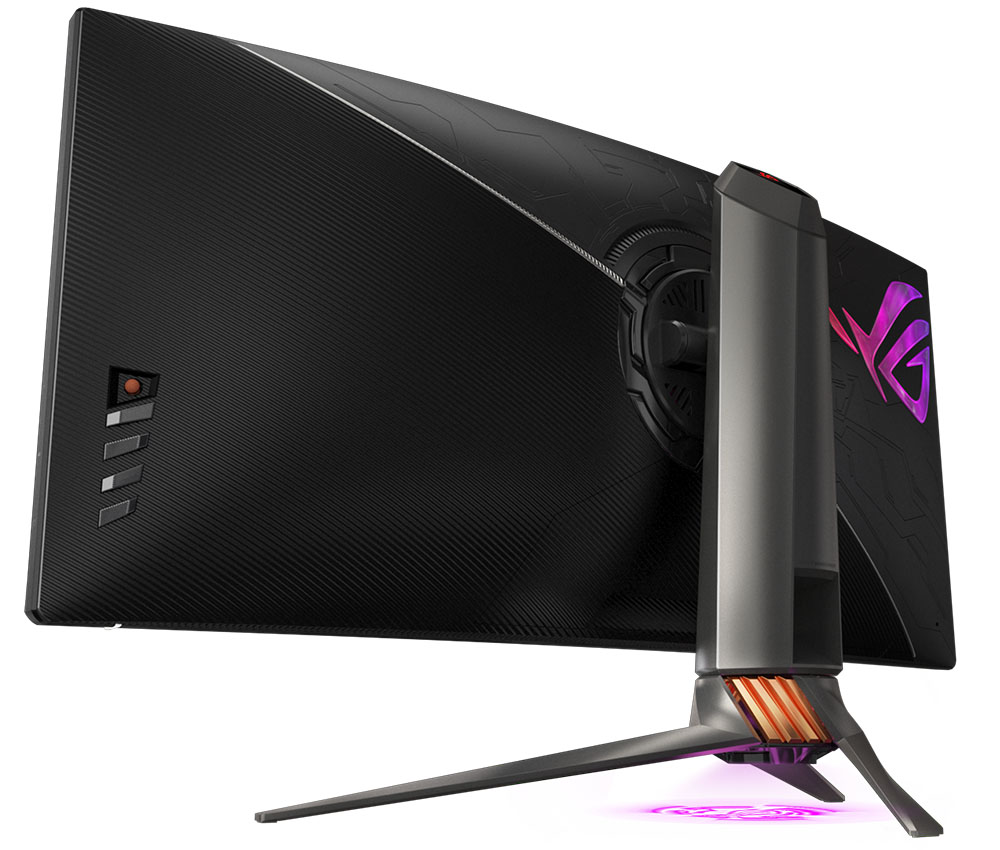
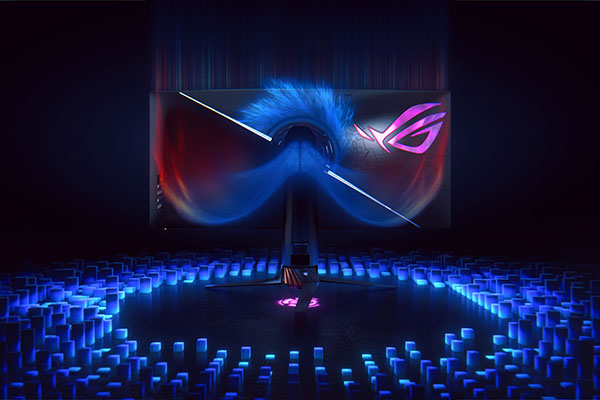
The back of the screen is encased in a matte black plastic with some etched patterns on it. The OSD control joystick and buttons are located on the back right hand side (when viewed from the front). Also on the back of the screen is a larger ROG logo which glows different colours if you activate it via the OSD menu. You can either set it to a range of different colour modes, cycles or effects using the ‘Aura RGB’ section, or you can sync this with your other ‘Aura Sync’ devices like keyboards, mouse etc if you have them. When it’s turned off, that logo actually looks like a shiny silver section which makes it look nice and eye-catching even with the lighting turned off.
In the top of the stand is another smaller ROG logo which glows red if you have turned on the ‘Light in Motion’ ROG Light Signature which projects from the bottom of the stand. The ‘ROG Light Signal’ which projects a red ROG logo on to the ceiling or wall behind the screen that was featured on the 27″ PG27UQ is not included here.
All these lighting features are quite fun, and we expect some users will want to have them turned on to enhance the appearance of their gaming setup and to grab attention. You can of course turn them off, but they do help to add a bit of a premium feel to the screen through some added gadgets we felt. Asus says that they “appreciate lighting effects might not be for everyone and they are always optional to use, however, overwhelmingly RGB-infused products prove more popular, so ASUS is committed to expanding on this in-demand experience, especially in premium gaming products such as the PG35VQ.“

A new cooling fan with Smart Fan Control
Above: side view of the screen. Click for larger versions
One thing we should mention is that like the 27″ PG27UQ there is a small internal fan in this screen which is needed to ensure it stays cool enough, especially during high refresh HDR gaming. It helps keep the G-sync module and FALD backlight cooler. The PG27UQ and other competing screens were criticised by some because of this fan, especially when it would sometimes get very noisy during intensive gaming sessions, and then stay loud for 30 minutes or so afterwards while it cooled down. Asus have this to say about the new “Smart Fan Control” system used for the newer PG35VQ:
“HDR monitors with full array backlights contain thousands of high-brightness LEDs that require a lot of power, and thus produce a significant amount of heat. Like most high-performance PC equipment, fans are required to remove this heat in order to ensure stable operation – the PG35VQ houses three in its chassis. Acting on feedback from our first generation of HDR gaming displays we’ve worked to improve the thermal performance through combination of improved heatsink design, the addition of a third fan to increase airflow without increasing noise, and ROG engineers have implemented a Smart Fan Control technology that’s been derived from other tried-and-tested ASUS ROG products. ASUS ROG is one of the only companies with this wealth of cross-product technical IP. This technology treats each fan independently and balances the cooling to keep noise at a minimum. From where a user sits in front of the PG35VQ the fans operate at just ~23dB – virtually inaudible – and during HDR media playback or gaming when the cooling requirement increases, users will be listening to the movie or game through speakers or headphones so the display will never be noticeable.“
We found that for normal day to day use the fan was very hard to hear at all from a normal viewing distance. If you moved much closer to the screen you could detect a faint hum from the fan but it was pretty quiet. We don’t have access to the 27″ PG27UQ to make a side by side comparison, but it does seem a little quieter than the old model from what we can remember. The fan speed will increase depending on the content you are viewing, so during intense high refresh rate and HDR gaming it may well become louder. This is hard to measure and quantify but hopefully the new Asus Smart Fan control will help keep noise to a minimum while dissipating heat effectively.
The stand offers a very good range of ergonomic adjustments. Tilt provides a wide adjustment range but is a little stiff to operate. Height adjustment is easier to move and smooth to operate. At the lowest height adjustment the bottom edge of the screen is about 60mm from the desk, and at maximum extension about 160mm. This provides a 100mm total height adjustment range as advertised. Side to side pivot is smooth and easy to use too. There is no rotation adjustment given the ultrawide format and curved screen. The screen remains very stable when adjusted and in normal use, with the stand providing a sturdy base for the screen.
A summary of the ergonomic adjustments are shown below:

The back of the screen features the connections as shown below. Useful to see headphone output and 2x USB 3.0 ports provided.

The OSD control joystick and buttons are located on the back right hand side (when viewed from the front). There is quick access from two of the buttons to the GamePlus extra options like the FPS counter and crosshair from one button, and the volume and audio settings from another.


The OSD software is familiar from other ROG gaming screens. The menu has 7 sections down the left hand side, with options available then shown to the right. Navigation is quick, easy and intuitive thanks to the joystick control. There’s a fairly large range of options to play with as well, many of which we will look at throughout this review.
Power Consumption

We have plotted the power measuring results below compared with other screens we have tested. This was without the FALD or any of the lighting or other extras active by the way. The consumption (comparing the calibrated states) is a bit more than most of the other ultrawide screens as you might expect. We’d seen similar from the PG27UQ which used a bit more power than the other 27″ models which don’t have a FALD.

Panel and Backlighting

Panel Part and Colour Depth
The Asus ROG Swift PG35VQ features an AU Optronics M350QVR01.7 AMVA (VA-type) technology panel. The panel offers 1.07 billion colours using an 8-bit + FRC colour depth. Some people may complain that the panel is not a native full 10-bit panel, but in reality you are going to be very hard pressed to see any real difference in practice between a good 8-bit+FRC panel and a true 10-bit panel. Even more so when you consider whether you’re going to actually be able to use the 10-bit colour depth in real use. Whether or not you can make use of this 10-bit colour depth depends on your graphics card and applications although many consumer gaming graphics card will be able to use it for modern games and HDR. You would need a high end professional grade graphics card to make use of 10-bit in pro applications like Photoshop though.
Screen Coating
The screen coating is a light anti-glare (AG) offering. It isn’t a semi-glossy coating, but it is light as seen on other modern VA type panels. Thankfully it isn’t a heavily grainy coating like some much older IPS panels feature and is also lighter than modern TN Film panel coating. It retains its anti-glare properties to avoid too many unwanted reflections of a full glossy coating, but does not produce too grainy or dirty an image that some thicker AG coatings can.
Backlight Type and Colour Gamut
The screen uses an LED backlight unit with an added Quantum Dot Enhancement Film (QDEF) coating to extended the colour space and gamut. This allows for a high coverage of the DCI-P3 colour space which is the reference used for HDR content and displays and something you will see more commonly talked about with TV’s and monitors in the future. This screen offers “up to 90% coverage” of the DCI-P3 colour space according to the specs, something that we will verify and test in a moment. This corresponds to around 125% of the commonly used sRGB reference.
Basically the screen is capable of producing a wider range of colours than most monitors, which are normally based around providing coverage of the common sRGB colour space. With the Quantum Dot coating film, the PG35VQ can cover beyond that, producing more bright and vivid colours to enhance gaming, multimedia and HDR content. High coverage of the DCI-P3 colour space is a requirement if a display is to conform to common HDR standard such as the VESA DisplayHDR 1000 certification.
If you want to read more about colour spaces and gamut then please have a read of our detailed article.
Backlight Dimming and Flicker
We tested the screen to establish the methods used to control backlight dimming. Our in depth article talks in more details about a previously very common method used for this which is called Pulse Width Modulation (PWM). PWM involves the rapid switching of the backlight off/on to simulate lower brightness levels when you adjust the screen’s brightness control. This in itself gives cause for concern to some users who have experienced eye strain, headaches and other symptoms as a result of the flickering backlight caused by this technology. We use a photosensor + oscilloscope system to measure backlight dimming control with a high level of accuracy and ease. These tests allow us to establish:
1) Whether PWM is being used to control the backlight
2) The frequency and other characteristics at which this operates, if it is used
3) Whether a flicker may be introduced or potentially noticeable at certain settings
If PWM is used for backlight dimming, the higher the frequency, the less likely you are to see artefacts and flicker. The duty cycle (the time for which the backlight is on) is also important and the shorter the duty cycle, the more potential there is that you may see flicker. The other factor which can influence flicker is the amplitude of the PWM, measuring the difference in brightness output between the ‘on’ and ‘off’ states. Please remember that not every user would notice a flicker from a backlight using PWM, but it is something to be wary of. It is also a hard thing to quantify as it is very subjective when talking about whether a user may or may not experience the side effects.
The Tests for this display are shown below.
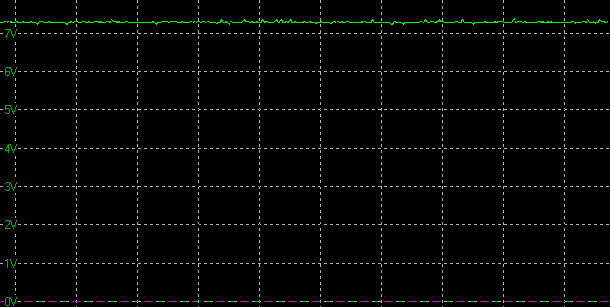

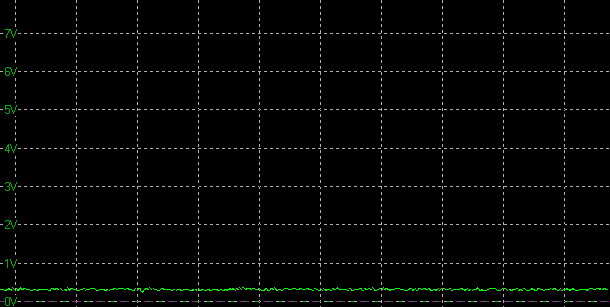
Above scale = 1 horizontal grid = 5ms
At all brightness settings a constant Direct Current (DC) voltage is applied to the backlight, and the screen is free from the obvious off/on switching of any PWM dimming method. As a result, the screen is flicker free as advertised.

Brightness and Contrast
This section tests the full range of luminance (the brightness of the screen) possible from the backlight, while changing the monitors brightness setting in the OSD menu. This allows us to measure the maximum and minimum adjustment ranges, as well as identify the recommended setting to reach a target of 120 cd/m2 for comfortable day to day use in normal lighting conditions. Some users have specific requirements for a very bright display, while others like a much darker display for night time viewing or in low ambient light conditions. At each brightness level we also measure the contrast ratio produced by the screen when comparing a small white sample vs. a black sample (not unrealistic full screen white vs. full screen black tests). The contrast ratio should remain stable across the adjustment range so we also check that.
Graphics card settings were left at default with no ICC profile or calibration active. Tests were made using an X-rite i1 Display Pro colorimeter. It should be noted that we used the BasICColor calibration software here to record these measurements, and so luminance at default settings may vary a little from the LaCie Blue Eye Pro report you will see in other sections of the review.

At the full brightness setting in the OSD the maximum luminance reached a very high 523 cd/m2 which was a little higher than the specified maximum brightness for SDR content of 500 cd/m2 from the manufacturer in fact. There was a very wide 503 cd/m2 adjustment range in total, so at the minimum setting you could reach down to a low luminance of 20 cd/m2. This should be more than low enough for most people including those wanting to work in darkened room conditions with low ambient light. A setting of 21 in the OSD menu should return you a luminance of around 120 cd/m2 at default settings. It should be noted that the brightness regulation is controlled without the need for Pulse Width Modulation for all brightness settings so the screen is flicker free.


We have plotted the luminance trend on the graph above. The screen behaves as it should in this regard, with a reduction in the luminance output of the screen controlled by the reduction in the OSD brightness setting. This is a linear relationship.
The average contrast ratio of the screen was measured at an impressive 2243:1 which was very good thanks to the VA technology panel. This was however slightly under the 2500:1 spec.
SDR Contrast Ratio with FALD Active
Note that the figures above are for the static contrast ratio without the ‘variable backlight’ (Full Array Local Dimming) turned on. That can operate in both SDR and HDR content and can significantly increase the active perceived contrast ratio of the screen. Dark areas are dimmed, and brighter areas are turned up. With a screen calibrated to around 120 cd/m2 and FALD active in SDR mode we measured a black depth of less than 0.02 cd/m2 which is the lower limit of the i1 Display Pro measurement device. Therefore we had an active contrast ratio of over 6000:1. This was for where a small white sample on the screen was compared with a measurement of a black part of the screen furthest away.
Actually you can achieve the same black point of <0.02 cd/m2 even when you increase the brightness up to the maximum 100% setting (523 cd/m2 luminance peak), and therefore you can achieve active contrast ratios of over 26,000:1 even in SDR mode. The FALD is capable of producing some very strong active contrast ratios even in SDR content, and you are only really limited by the maximum luminance in terms of how high that contrast ratio will go.
HDR contrast will be looked at later on in the review.
Testing Methodology
An important thing to consider for most users is how a screen will perform out of the box and with some basic manual adjustments. Since most users won’t have access to hardware colorimeter tools, it is important to understand how the screen is going to perform in terms of colour accuracy for the average user.
We restored our graphics card to default settings and disabled any previously active ICC profiles and gamma corrections. The screen was tested at default factory settings using our new X-rite i1 Pro 2 Spectrophotometer combined with LaCie’s Blue Eye Pro software suite. An X-rite i1 Display Pro colorimeter was also used to verify the black point and contrast ratio since the i1 Pro 2 spectrophotometer is less reliable at the darker end.
Targets for these tests are as follows:
- CIE Diagram – confirms the colour space covered by the monitors backlighting in a 2D view, with the black triangle representing the displays gamut, and other reference colour spaces shown for comparison. Usually shown as a comparison against the common sRGB space
- Colour space coverage volumes – we also measure using a piece of software called ChromaPure the colour space (gamut) volumes produced by the backlight in comparison to the sRGB, DCI-P3 and Rec.2020 colour spaces. sRGB is the most commonly used colour space so it is important to have a decent coverage from the screen here. If the colour space is >100% sRGB then the screen can produce a wider colour gamut, often reaching further in to the wider gamut DCI-P3 (commonly used for HDR) and Rec.2020 reference spaces.
- Gamma – we aim for 2.2 which is the default for computer monitors
- Colour temperature / white point – we aim for 6500k which is the temperature of daylight
- Luminance – we aim for 120 cd/m2, which is the recommended luminance for LCD monitors in normal lighting conditions
- Black depth – we aim for as low as possible to maximise shadow detail and to offer us the best contrast ratio
- Contrast ratio (static) – we aim for as high as possible. Any dynamic contrast ratio controls are turned off here if present
- dE average / maximum – we aim for as low as possible. If DeltaE >3, the color displayed is significantly different from the theoretical one, meaning that the difference will be perceptible to the viewer. If DeltaE <2, LaCie considers the calibration a success; there remains a slight difference, but it is barely undetectable. If DeltaE < 1, the color fidelity is excellent.
Default Setup and Factory Calibration
The screen carries a factory calibration which is applicable in the default state of the monitor. This applies in the ‘Racing mode’ preset and is factory calibrated to achieve accurate grey-scale tracking with 2.2 gamma, and a a delta E of <2. This is better than that provided with the PG27UQ actually which was dE <3 calibrated. It should be noted that the monitor is by default set to produce an sRGB colour space and is set to operate in normal SDR (Standard Dynamic Range) mode. Enabling wide gamut can be done via the OSD menu and we will look at those a bit more in a moment.
The screen comes with a specific factory calibration report for the unit as shown by the example which came with ours:

Default settings of the screen were as follows:

Before we started we turned off the ‘variable backlight’ option within the OSD menu. That controls the FALD backlight and can be used in SDR and HDR modes to dim and brighten different areas of the screen depending on the content to enhance the contrast and dynamic range. We wanted to test the screen out of the box without this happening, particularly so we could accurately measure the luminance and static contrast ratio of the panel. Initially out of the box the screen was set with the GameVisual preset mode set to ‘Racing mode’ and the other default settings shown above. The screen felt very bright to the naked eye, even though the brightness control was set at a fairly modest 60% – a lot of screens come set at 100%. Colour balance felt good and you could tell that out of the box the screen was operating with a standard sRGB colour space. We went ahead and measured the default state with the i1 Pro 2. The CIE diagram on the left of the image confirms that the monitors colour gamut (black triangle) matches the sRGB colour space reference (orange triangle) closely. We measured using ChromaPure software a 103.6% sRGB gamut coverage which corresponds to 76.3% of the DCI-P3 reference and 54.8% of the Rec.2020 reference. This was slightly wider than the provided Asus’ factory measurements recorded in the calibration report of 99.7% sRGB but no major issue at all. It’s good to see a reliable sRGB emulation available easily from this screen.

Remember, the screen is set to operate in an sRGB emulation mode out of the box while in SDR settings, and so you are not seeing the full range of colours possible from the backlight and Quantum Dot coating. It’s very easy to switch up to the wide gamut mode in the OSD menu using the ‘Display SDR input’ option, switching that from sRGB to wide gamut.


Above: colour space coverage comparing normal sRGB mode (left) and wide gamut mode (right)

If you switch to this wide gamut mode you can see an immediate and fairly noticeable difference to the colours. They look more bright and vivid, as is typical for a screen based on a wide gamut backlight. It’s not as drastic a change as we saw when we tested the PG27UQ in Aug 2018 though as the gamut is a little more modest. The CIE diagrams above show that the monitors colour space now stretches a fair way beyond the sRGB reference space, mostly in red and green shades. We measured a coverage of 119.5% sRGB, which corresponds to 88.1% DCI-P3 and 63.2% Rec. 2020. This was a little shy of the advertised 90% DCI-P3 coverage but not by much. This wider gamut should give you a nice boost in colours and vividness for gaming, multimedia and importantly for HDR content.
As a side note out of interest, when we tested the smaller 27″ PG27UQ model this had an advertised 97% DCI-P3 spec, but actually produced 110.3% coverage! That model has a wider colour gamut, especially in green shades. The gamma and white point performance of the PG335VQ remain the same regardless of whether you switch to sRGB or wide gamut mode.
Default gamma of the screen was recorded at 2.3 average, with a small 6% deviance from the target which was good. The gamma looked to be a little off in the lighter grey shades. White point was measured at a pretty accurate 6328k being only a small 3% out from our 6500k target. Luminance was recorded at a very bright 320 cd/m2 which is far too high for prolonged general use, you will need to turn that down. The screen was set at a default 60% brightness in the OSD menu but that is easy to change of course to reach a more comfortable setting without impacting any other aspect of the setup. A strength of the VA technology panel used here, the black depth was 0.15 cd/m2 at this default brightness setting giving us a good static contrast ratio of 2080:1. Remember that the active contrast ratio will be significantly enhanced if you operate the ‘variable backlight’ FALD in both normal SDR mode and when using HDR mode and content. We will test that more later on.
Colour accuracy was very good out of the box with an average dE of 1.3 and a maximum of 2.6. Testing the screen with colour gradients showed smooth gradients with only very minor gradation evident in the darker tones. There was no sign of any colour banding which was good news.
Overall this was a good factory calibration with fairly accurate gamma and white point, very good colour accuracy, strong contrast ratio and reliable emulation of the sRGB colour space, with the ability to easily switch to the wide gamut mode if you want. We weren’t sure how this was going to work before testing the screen in relation to the colour space and Quantum Dot film coating, but it was great to see the availability of an sRGB mode for those who want to use the screen for other things beyond gaming and multimedia. Sure, you might want the boosted, more vivid colours of the wide gamut capability for those uses, but unless you’re specifically working with wide gamut content in a colour managed workflow, you will probably want to use the sRGB mode for photo, colour work and more general office uses.
Gamma Setting Measurements
| Gamma OSD setting | Measured Gamma Average | Deviance from 2.2 target |
| 1.8 | 1.9 | 13% |
| 2.0 | 2.1 | 3% |
| 2.2 | 2.3 | 6% |
| 2.4 | 2.6 | 16% |
| 2.6 | 2.8 | 26% |
We also carried out measurement of each of the gamma modes available via the OSD menu. Some of the GameVisual preset modes have different default settings for gamma as well keep in mind, and you can always customise some of the presets to your liking. All of the modes showed a slightly too high average gamma compared with the desired target but nothing too major. The 2.0 mode seemed closest to our 2.2 target and may be preferable to use.
Color Temp Setting Measurements
| Colour Temp OSD setting | White point measurement |
| Normal | 6328k |
| Warm | 5250k |
| Cool | 6953k |
| User Mode | 6328k |
We carried out a test of the various Color Temp modes as well out of interest and the results as shown above. The normal mode was closest to our 6500k target which was good news. The other modes behaved as they should, offer various options for a cooler or warmer setup. The User mode was the same as the normal mode by default, but gives you access to the RGB channels for customised calibration.
Calibration
We used the X-rite i1 Pro 2 Spectrophotometer combined with the LaCie Blue Eye Pro software package to achieve these results and reports. An X-rite i1 Display Pro colorimeter was used to validate the black depth and contrast ratios due to lower end limitations of the i1 Pro device.

We changed here to the user mode in the colour temp menu which gives you access to the RGB channel adjustments. We also changed the default 2.2 gamma mode to 2.0 which we knew to be a little closer to the target out of the box. Settings were adjusted as shown in the table above, as guided during the calibration process and measurements. These OSD changes allowed us to obtain an optimal hardware starting point and setup before software level changes would be made at the graphics card level. We left the LaCie software to calibrate to “max” brightness which would just retain the luminance of whatever brightness we’d set the screen to, and would not in any way try and alter the luminance at the graphics card level, which can reduce contrast ratio. These adjustments before profiling the screen would help preserve tonal values and limit banding issues. After this we let the software carry out the LUT adjustments and create an ICC profile.
Average gamma was measured at 2.2 average (0% deviance) which fixed the very small 3% deviance we’d seen out of the box in the 2.0 gamma mode. The accurate white point of the default mode was maintained here, but we corrected the small 3% deviance and we now measured a colour temperature of 6473k. Luminance had been improved thanks to the adjustment to the brightness control and was now being measured at a far more comfortable 123 cd/m2. This left us still with a strong black depth of 0.07 cd/m2 and a static contrast ratio of 1781:1 which was good thanks to the VA panel technology. It had taken a bit of a hit due to the (admittedly pretty minor) RGB adjustments and the profiling of the screen and so was a bit lower than our default 2080:1 measurement. Still much higher than competing technologies like TN Film or IPS.
Colour accuracy of the resulting profile was excellent too, with dE average of 0.3 and maximum of 1.0. LaCie would consider colour fidelity to be excellent. Testing the screen with various colour gradients showed very smooth transitions with only some very minor gradation in darker tones. You can use our settings and try our calibrated ICC profile if you wish, which are available in our ICC profile database. Keep in mind that results will vary from one screen to another and from one computer / graphics card to another.
Calibration Performance Comparisons

The comparisons made in this section try to give you a better view of how each screen performs, particularly out of the box which is what is going to matter to most consumers. We have divided the table up by panel technology as well to make it easier to compare similar models. When comparing the default factory settings for each monitor it is important to take into account several measurement areas – gamma, white point and colour accuracy. There’s no point having a low dE colour accuracy figure if the gamma curve is way off for instance. A good factory calibration requires all 3 to be well set up. We have deliberately not included luminance in this comparison since this is normally far too high by default on every screen. However, that is very easily controlled through the brightness setting (on most screens) and should not impact the other areas being measured anyway. It is easy enough to obtain a suitable luminance for your working conditions and individual preferences, but a reliable factory setup in gamma, white point and colour accuracy is important and some (gamma especially) are not as easy to change accurately without a calibration tool.
From these comparisons we can also compare the calibrated colour accuracy, black depth and contrast ratio. After a calibration the gamma, white point and luminance should all be at their desired targets.

Default setup of the screen out of the box was good overall thanks to the factory calibration, with reliable white point, strong contrast, good colour accuracy and a reliable sRGB mode. You can easily switch up to the full native gamut offering a bit of a boost to colours if you want for gaming and multimedia. The gamma was slightly off with a 6% deviance, and that’s really the only area which was a slight issue. You can improve things with a simple change to the gamma 2.0 mode in the menu though to bring it closer to the target (3% deviance). The colour accuracy was a little better than competing 35″ ultrawide VA models like the Acer Predator Z35 (2.1), AOC AGON AG352UCG (1.9), Asus ROG Strix XG35VQ (1.8) and BenQ EX3501R (2.2) but overall the default setup was quite similar amongst these screens. The PG35VQ was the only one of these models to offer a wider colour gamut mode though for HDR and gaming.

When it comes to black depth and contrast ratio the screen performed well thanks to the VA technology panel at 1781:1 after calibration. Remember this is without the FALD active, which can allow for MUCH higher contrast ratios in both SDR and HDR content. What we are comparing here is the native contrast ratio of the panel really. The contrast ratio measured (1781:1) was similar to other modern ultrawide VA panels we’ve tested like the BenQ EX3501R (1747:1) and Asus ROG Strix XG35VQ (1938:1), and had dropped a bit from the out of the box contrast due to the calibration and adjustments to the RGB channels primarily. Some other VA panels can reach up much higher than this including the much older Acer Predator Z35 35″ ultrawide model (2813:1). More recent generations of VA panel do seem to offer lower contrast ratios it seems. The PG35VQ can obviously perform much better than this for multimedia and gaming if you enable the FALD backlight which we will look at later on in more detail.
| Check Availability and Pricing – Affiliate Links |
|---|
| Amazon |
| TFTCentral is a participant in the Amazon Services LLC Associates Programme, an affiliate advertising programme designed to provide a means for sites to earn advertising fees by advertising and linking to Amazon.com, Amazon.co.uk, Amazon.de, Amazon.ca and other Amazon stores worldwide. We also participate in a similar scheme for Overclockers.co.uk. |
Viewing Angles
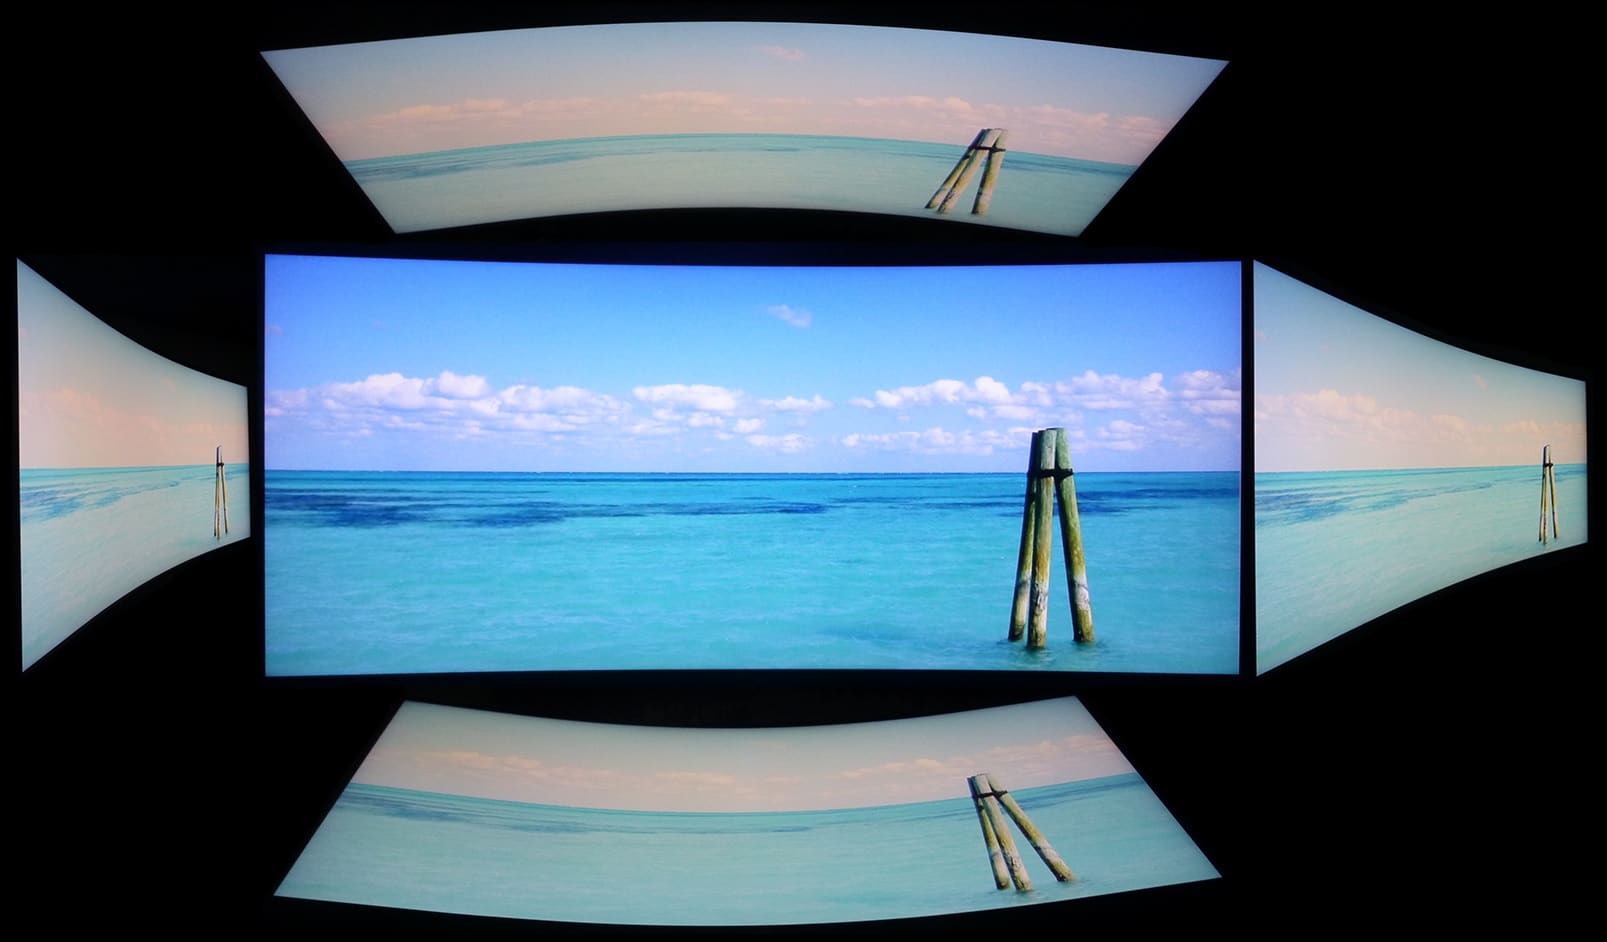
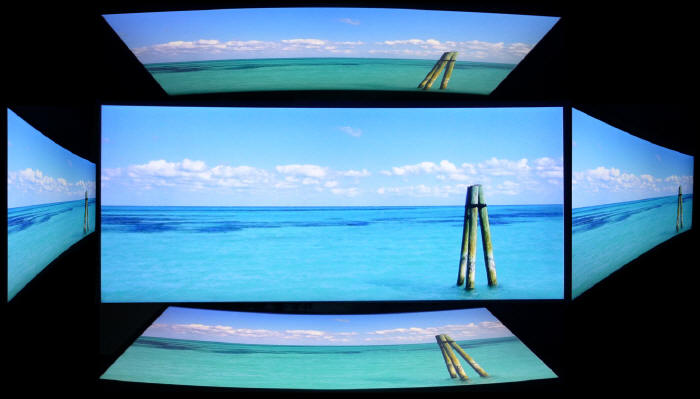
Viewing angles of the screen were moderate. The image behaved more like older generation VA panels than some of the modern VA screens we’ve tested. From a side angle, the image became washed out and pale in appearance as you can see. They were a little better actually than competing models like the AOC AGON AG352UCG from March 2017 and Acer Predator Z35 we tested in January 2016. There was a little less washout on the PG35VQ here than those models which was pleasing. The PG35VQ was comparable really with the Asus ROG Strix XG35VQ from Dec 2017 in this regard.
However the colour tone and gamma shifts were more noticeable of course than IPS-type panels, including the 34″ Dell Alienware AW3418DW and Acer Predator X34 as an example. Users should also be aware that the panel exhibits the off-centre contrast shift which is inherent to the VA pixel structure. When viewing a very dark grey font for example on a black background, the font almost disappears when viewed head on, but gets lighter as you move slightly to the side. This is an extreme case of course as this is a very dark grey tone we are testing with. Lighter greys and other colours will appear a little darker from head on than they will from a side angle, but you may well find you lose some detail as a result. This can be particularly problematic in dark images and where grey tone is important. It is this issue that has led to many graphics professionals and colour enthusiasts choosing IPS panels instead, and the manufacturers have been quick to incorporate this alternative panel technology in their screens. We would like to make a point that for many people this won’t be an issue at all, and many may not even notice it. Remember, many people are perfectly happy with their TN Film panels and other VA based screens. Just something to be wary of if you are affected by this issue or are doing colour critical work.
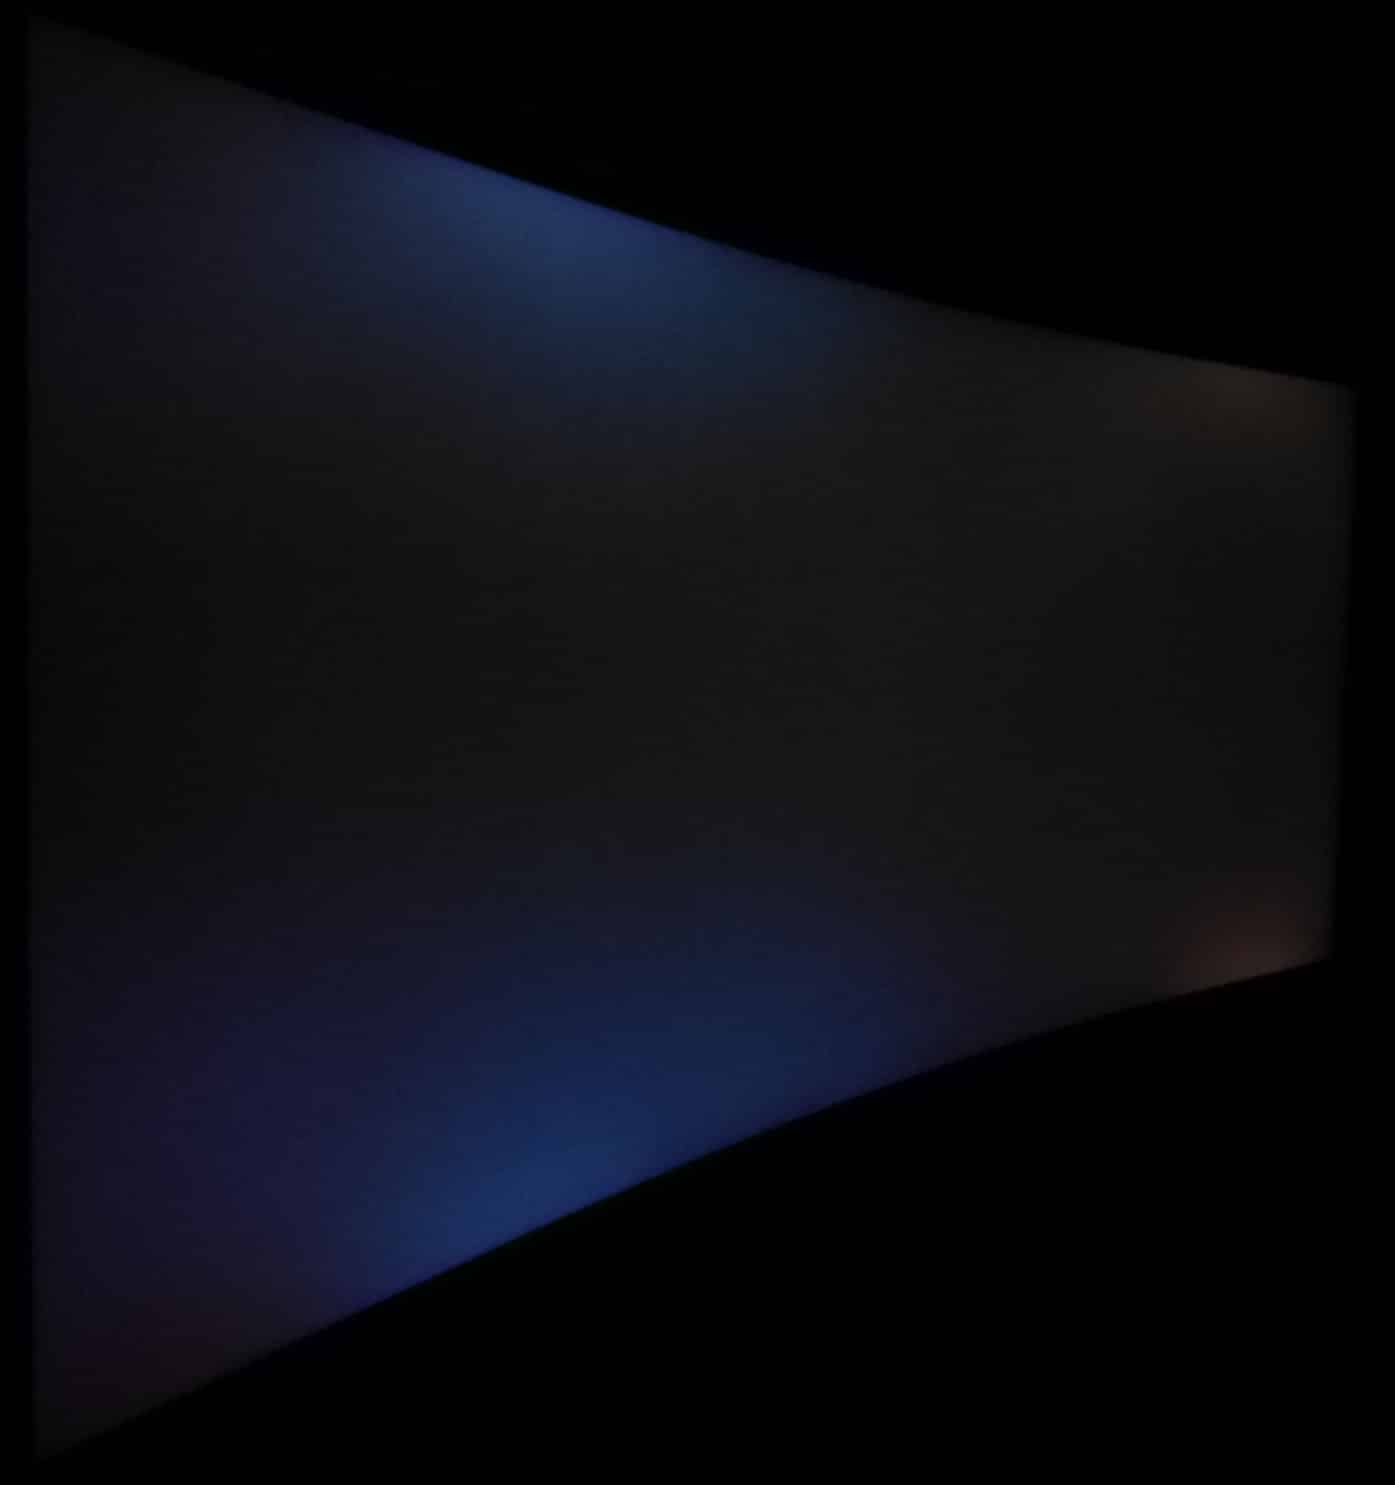
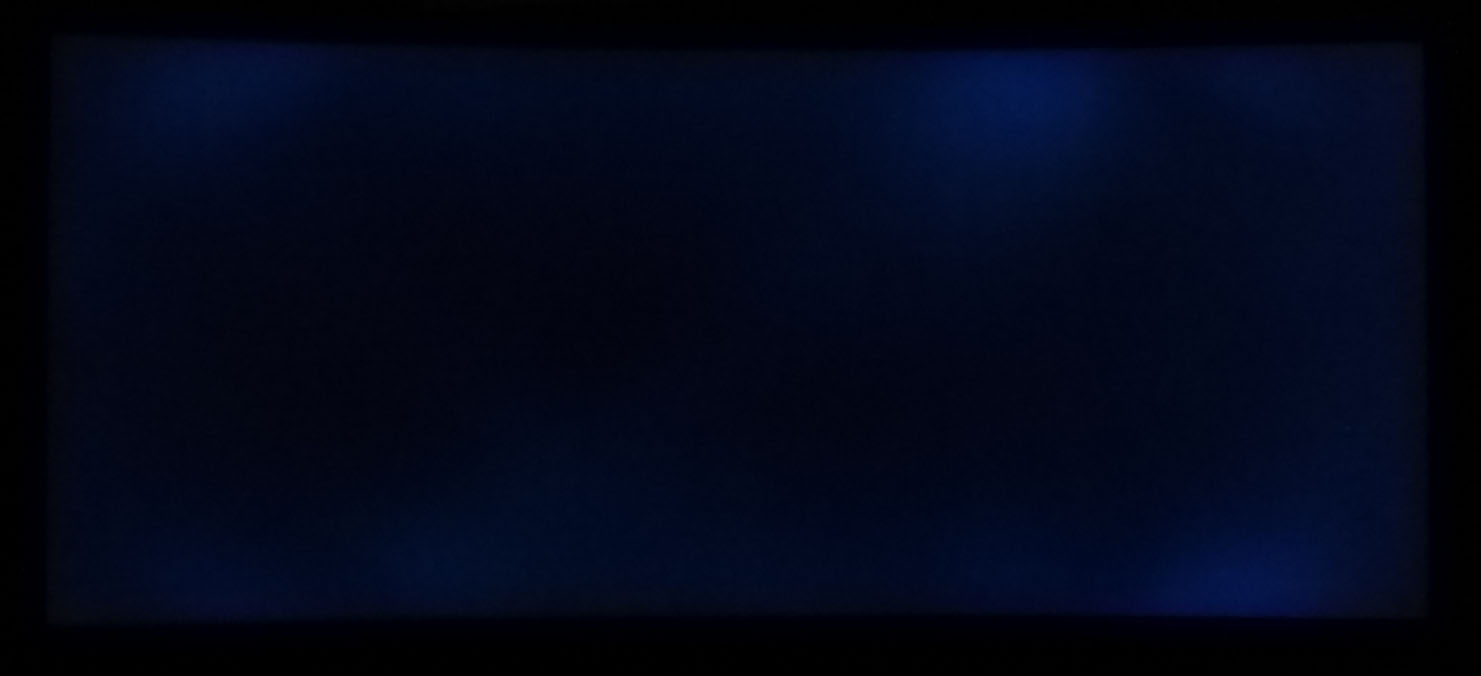
Above: View of an all black screen from the sides. Click for larger version
We captured a photo of an all-black image as viewed from a side angle as shown above. This can help exhibit any glow you might see on different panel technologies. Here, the actual glow caused by the VA panel technology was low, with some pale areas picked up in the photo. This side-angle photo actually captures some of the uniformity issues we measure in the following section (when FALD is off), and you can clearly see the darker and lighter areas of the screen. From a head on viewing position this is harder to see, but viewing the screen from a side angle accentuates it. We had seen a very similar situation on the Asus ROG Strix XG35VQ and AOC AGON AG352UCG incidentally. Here on the PG35VQ the black image showed less of a pale/bluish glow than those models though which was pleasing.
Panel Uniformity
We wanted to test here how uniform the brightness was across the screen, as well as identify any leakage from the backlight in dark lighting conditions. Measurements of the luminance were taken at 35 points across the panel on a pure white background. The measurements for luminance were taken using BasICColor’s calibration software package, combined with an X-rite i1 Display Pro colorimeter with a central point on the screen calibrated to 120 cd/m2. The below uniformity diagram shows the difference, as a percentage, between the measurement recorded at each point on the screen, as compared with the central reference point.
It is worth noting that panel uniformity can vary from one screen to another, and can depend on manufacturing lines, screen transport and other local factors. This is only a guide of the uniformity of the sample screen we have for review.
Uniformity of Luminance

Luminance uniformity of the screen was good overall really, with the right and left hand sides of the screen showing the most deviance from our centrally calibrated point. In the corners the luminance dropped down to 100 cd/m2 in the most extreme example (-20%). 69% of the screen was within a 10% deviance of the centrally calibrated point which was good.
Backlight Leakage

We also tested the screen with an all black image and in a darkened room. This was done with the FALD turned off. A camera was used to capture the result. There was some fairly noticeable clouding and blotching of the backlight along the top and bottom edge and the upper left and lower right corners. It might be quite hard to pick out from the above photo given the strong black depth of the VA panel but it was visible in these tests with the naked eye. You wouldn’t notice this in normal day to day use from a head on viewing position, but you could see these lighter clouded areas on dark content and from an angle. This blotchiness is likely due to the complex Full Array Local Dimming (FALD) backlight where each section is independently lit and controlled. If you enable the FALD then the black depth is very deep and the whole screen looks much darker, while also removing all the noticeable blotchy areas.

Above: accentuated by a slow shutter speed to demonstrate areas of backlight clouding. Click for larger version
We have also captured the same photo but at a slower shutter speed to try and make this clearer in the photo. This is an exaggeration of what it really looks like to the naked eye, but will highlight the areas of concern on our sample a bit better than the initial photo.
Note: if you want to test your own screen for backlight bleed and uniformity problems at any point you need to ensure you have suitable testing conditions. Set the monitor to a sensible day to day brightness level, preferably as close to 120 cd/m2 as you can get it (our tests are once the screen is calibrated to this luminance). Don’t just take a photo at the default brightness which is almost always far too high and not a realistic usage condition. You need to take the photo from about 1.5 – 2m back to avoid capturing viewing angle characteristics, especially on IPS-type panels where off-angle glow can come in to play easily. Photos should be taken in a darkened room at a shutter speed which captures what you see reliably and doesn’t over-expose the image. A shutter speed of 1/8 second will probably be suitable for this.
General and Office Applications
One of the key selling points of ultra-wide screens like the this is it’s high resolution and large screen size. The 3440 x 1440 display offers a sharp but comfortable picture. Its pixel area is about 1.8 times larger than an Ultra-Wide Full HD 21:9 monitor, and about 2.4 times larger than a Full HD 16:9 monitor. It provides an efficient environment in using Microsoft Office programs showing 47 columns and 63 rows in excel. Thankfully the high resolution is of a very comfortable size on the 35″ panel, with a 0.2384mm pixel pitch is is very comparable to a 27″ 2560 x 1440 monitor (0.2331mm), and only slightly larger than a 34″ screen with equivalent resolution. This means you are basically getting a wider desktop to work with, with a similar font size to a 27″ model, and maintaining the same vertical resolution as well. If you’re coming from a lower resolution / larger pixel pitch you may still find the fonts look quite small to start with, but like the 27″ 1440p models out there you soon get used to it. Side by side multi-tasking on this screen is excellent and you really do have a nice wide area to work with. We liked the curved format of the display actually for day to day office work. It just felt a bit more comfortable than a flat screen on a model as wide as this, bringing the corners a bit nearer to you. You didn’t really notice the curve in normal use but we liked the feel. Probably down to user taste, so if in doubt try and see one in person.
The light AG coating of the panel is welcome, and much better than the grainy and ‘dirty’ appearance of some other AG coatings on some displays. The pretty wide viewing angles helped minimize on-screen colour shift when viewed from different angles, with no major glow on dark content like you will see from most IPS panels. There was the normal VA off-centre contrast shift which might mean that viewing dark content or doing colour critical work is a little more tricky than on an IPS display. Also the image becomes more washed out and pale from a wide viewing position than competing IPS panel types. The default setup of the screen offered a decent enough performance with only minor deviations for gamma and white point. There was a reliable sRGB emulation mode available for those who don’t want to use the full native gamut of the screen, which is especially useful for colour and photo work with normal sRGB content. For those who do want to work with wider gamut content, the screen is capable of delivering 87.5% DCi-P3 coverage according to our measurements. The factory calibration also helped ensure a low dE out of the box and there was also a strong contrast ratio thanks to the VA panel technology, easily surpassing IPS and TN Film panels.
The brightness range of the screen was very good, with the ability to offer a luminance between 523 and 20 cd/m2 in normal mode with the FALD backlight turned off. This should mean the screen is perfectly useable in a wide variety of ambient light conditions, including darkened rooms. A setting of ~21 in the OSD brightness control should return you a luminance close to 120 cd/m2 out of the box. On another positive note, the brightness regulation is controlled without the need for Pulse Width Modulation (PWM), and so those who suffer from eye fatigue or headaches associated with flickering backlights need not worry. A range of blue light filter modes are provided to help reduce blue spectral output and make the screen easier on the eyes, especially for lots of text work or in darker room conditions.
The screen offers 2x USB 3.0 ports which is very handy although they are located on the back of the screen with the video connections so aren’t really easy access. There is also a headphone jack if you are sending sound to the screen via HDMI, although there’s no integrated speakers offered here. There is a built in ambient light sensor which is located on the top edge of the screen and is accessible via the ‘Auto SDR brightness’ setting in the OSD. We found that this made the image darker than we might like by default compared with our calibrated state. You can change the brightness control though to set your normal brightness level in your normal working conditions, and then let the auto sensor adjust this up and down in line with any changes to your ambient light conditions throughout the day. There aren’t any other extras like card readers provided here which are sometimes useful on office environments. The stand offers a wide range of adjustments which is great news, allowing you to obtain comfortable viewing positions easily.
Responsiveness and Gaming

The screen uses overdrive technology to boost pixel transitions across grey to grey changes as with nearly all modern displays. The part being used is an AU Optronics M350QVR01.7 AMVA (VA-type) technology panel. Have a read about response time in our specs section if you need additional information about this measurement.
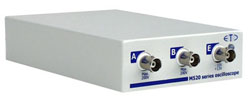 |
We use an ETC M526 oscilloscope for these measurements along with a custom photosensor device. Have a read of our response time measurement article for a full explanation of the testing methodology and reported data.

Graphics Card and System Considerations
| Check Pricing and Buy – Affiliate Links |
 NVIDIA RTX30 Series graphics cards: Amazon and Overclockers UK |
| TFTCentral is a participant in the Amazon Services LLC Associates Programme, an affiliate advertising programme designed to provide a means for sites to earn advertising fees by advertising and linking to Amazon.com, Amazon.co.uk, Amazon.de, Amazon.ca and other Amazon stores worldwide. We also participate in a similar scheme for Overclockers.co.uk. |
You will need to keep in mind that the PG35VQ is a very top-end display and to power it, you are going to need a powerful system for sure. Achieving 3440 x 1440 resolution at up to 200Hz refresh rate and for HDR gaming at high settings is going to be a challenge for even the best systems so to really make use of this display you are going to also need to invest in other expensive, powerful hardware. Note that it is important that your graphics card has a DisplayPort 1.4 interface as you are going to need that to achieve this resolution at the high refresh rates. Asus provide a DP cable in the box so you don’t need to worry about that thankfully. NVIDIA G-sync is there to cope with varying refresh rates which is very useful and should work very reliably since this screen features a traditional G-sync hardware module.
Response Times 60Hz (Consoles)


We carried out some initial response time measurements in each of the overdrive settings, along with some visual tests in order to identify what the optimal setting was. These tests were initially carried out at 60Hz which is going to be your limit for most externally connected devices and consoles.
With the OD setting ‘off’ the average G2G response times were slow at 16.1ms G2G which is quite typical for a VA-type panel. Switching up to ‘normal’ mode brought about some noticeable improvements to motion clarity and reductions in the measured response times, and perceived blurring on moving images. Average G2G was now measured at 12.5ms, and there was thankfully no overshoot problems introduced. As is common with nearly all VA technology panels, the transitions from black to grey (shown in the top row of the table) were the slowest, and significantly slower than all the other transitions. This is very common on this panel technology, and leads in practice to black smearing on moving images. That was quite pronounced here, especially on darker content and backgrounds. If we ignored those couple of particularly slow black > grey transitions, the average response time would be more like 8.1ms G2G which is a useful figure for comparisons throughout this section.
Pushing up to the ‘extreme’ OD setting helped reduce the response times a little more, down to 10.8ms G2G now overall. Only a very small amount of overshoot was introduced which was pleasing and not at all noticeable in practice. Again there were those problematic slow black > grey response times which still left us with some black smearing on moving content. If those were ignored again, the other response times had been improved nicely to 6.3ms G2G. Given that there is no noticeable overshoot introduced at 60Hz, even at the highest Extreme mode, we would recommend opting for the ‘Extreme’ mode if you’re gaming from a console or running at 60Hz.
This was significantly better than the last Asus 35″ ultrawide VA panel we tested, which was the ROG Strix XG35VQ (Dec 2017) where in 60Hz mode and at the optimal overdrive level we saw much slower response times across a wide range of transitions. This resulted in a 12.1ms G2G average when we ignored the particularly problematic black > grey transition, compared with 6.3ms here on the PG35VQ. At that optimal overdrive setting we also had a bit of overshoot creeping in whereas there’s none here on the PG35VQ. So certainly some good improvements.
High Refresh Rates up to 144Hz
100Hz Refresh Rate


144Hz Refresh Rate


When connected to a PC using the DisplayPort 1.4 interface you have access to the high refresh rate of the panel. We tested the screen again in the ‘normal’ and ‘extreme’ modes at settings of 100Hz and 144Hz. There was no point in testing the ‘off’ mode any further as there’s no reason to use it.
The overdrive behaviour of the screen does vary depending on the active refresh rate and shows the screen is using dynamic overdrive control, like many other G-sync module screens we’ve tested. We measured the response times with and without G-sync activated in the NVIDIA control panel incidentally, and it had no real impact to the measurements.
The ‘normal’ mode showed a good improvement compared with at 60Hz overall, with improvements in motion clarity brought about thanks to improving response times (except those problematic black > grey slow transitions) and also thanks to the increased refresh rate. The refresh rate of an LCD screen has a direct correlation with perceived blurring, so there are definite benefits in motion clarity with the jump between 60 > 100 >144Hz. We need to ignore the couple of very slow transitions for a moment to observe the difference each mode has.
The average G2G response time in ‘normal’ mode (excluding the very slow transitions) improved from 8.1ms > 7.2ms > 5.9ms as the refresh rate was increased. There was still no overshoot issues at all which was great news in this mode. These improvements in response times helps ensure the screen can keep up with the increased frame rates. At 100Hz, a new frame is sent to the screen every 10ms (1000ms / 100 frames = 10ms) and every 6.94ms at 144Hz. So the pixel response times need to be consistently and reliably below that to ensure optimal experience. This also avoids any additional blurring and smearing which can commonly appear if the response times are not fast enough to keep up with the frame rate. The only lingering problem were those typical slow black > grey transitions, so you still had a bit of black smearing on darker content unfortunately. There was no issue on lighter content at all, and the image looked smoother and clearer, helped by the improvements to pixel response times but mainly because of the increase of the refresh rate.
Pushing the OD setting up to the maximum ‘extreme’ setting improved the response times quite a bit, and actually sped up one of the previously very slow transitions (0 > 150) which was pleasing, especially at 144Hz. This helped cut down on some of the black smearing you could see. Unfortunately a pretty large amount of overshoot was introduced, and you could see pale trails and artefacts on moving content. Oddly, the transition from 0 > 150 that had been sped up massively from 19.5ms to 4ms (144Hz mode) showed no overshoot, so it goes to show that a correctly tuned overdrive impulse could tidy that up potentially. Still, with the overshoot starting to creep up to high levels in the ‘Extreme’ mode here, we would recommend sticking with the ‘normal’ mode if you are using the screen for refresh rates above 60Hz. This also applies if you are going to be using NVIDIA G-sync where refresh rate range might fluctuate within the refresh rate range supported.
Comparisons with Other 35″ Ultrawide VA Models
We can make some comparisons with other 35″ ultrawide VA panels we’ve tested as well here, when comparing the optimal settings on each screen at different refresh rates:
- At 100Hz the response time figures were quite comparable to the BenQ EX3501R tested in Jan 2019 (premium overdrive mode). That model was a tad faster on the slow black > grey transitions but did show some low to moderate overshoot creeping in, which is not an issue here on the PG35VQ (normal mode).
- At 100Hz the response times were very comparable to the Asus ROG Strix XG35VQ from Dec 2017 (level 5 overdrive), although that screen showed some moderate to high levels of overshoot to achieve them, whereas the PG35VQ has no overshoot (normal mode)
- At 100Hz it was also similar to the AOC AGON AG352UCG from March 2017 (medium overdrive mode), although again a bit of overshoot was creeping in on that model, but not here
So the overall view at 100Hz is that the response time figures on the PG35VQ were pretty comparable to other 35″ ultrawide VA panels we’ve tested, although there was no overshoot here which was pleasing and made the experience better. No annoying pale or dark halos on moving objects here.
None of the 3 models listed above support anything above 100Hz, so for 144Hz we can only compare with the Acer Predator Z35 which had a lower 2560 x 1080 resolution:
- At 144Hz the PG35VQ was a tad faster than the Acer Predator Z35 from Jan 2016 (normal overdrive mode) and had slightly less black smearing. On the Acer there was also some moderate to high overshoot creeping in as well, but there was none on the PG35VQ here. That led us to question at the time of reviewing the Z35 the practical usage of 144Hz and above as while the response times were just about keeping up with the frame rate, the overshoot started to cause issues and lead to noticeable halos on moving content. That’s not a problem here on the PG35VQ as there was no overshoot, so we felt that 144Hz was a useable refresh rate.
NVIDIA G-sync Ultimate
The presence of NVIDIA G-sync is very important on this screen given the huge system demands of powering a screen at 3440 x 1440 resolution and up to 200Hz refresh rate. This will dynamically control the refresh rate and remove tearing and stuttering without any of the added lag that older vsync technology causes. G-sync works by synchronizing the display’s refresh interval with the incoming frame rate, banishing lag and ensuring gameplay stays buttery-smooth even when there are large changes in system rendering times. Its presence helps eliminate jarring visual artifacts, and even allows a single, high-performance graphics card to leverage many of the PG35VQ’s benefits. On this screen the v2 module is used which is needed to support the high resolution and refresh rate. It is part of the “G-sync Ultimate” certified family as this model also has a FALD backlight to offer HDR 1000 capabilities.
One thing sadly missing from this screen is support for an ULMB (Ultra Low Motion Blur) strobing backlight. This was not possible to include with the FALD backlight sadly. Although G-sync is far more useful and valuable anyway given the high demands of the resolution and high refresh rates. You can’t use ULMB and G-sync at the same time currently (although some recently announced screens are changing that), so even if it was available, it would not be as useful as the G-sync variable refresh rate support.
Colour Compression for >144Hz
This will be familiar to those to those who read our PG27UQ review or understand how some of the existing high res/high refresh rate screens are pushed to their limits. To achieve the native 3440 x 1440 resolution and high refresh rates the bandwidth capabilities of the latest DisplayPort 1.4 interface are already being pushed to their limit. The interface is just not capable of supporting the really high end of the refresh rate without some sacrifices, and so to achieve the higher end refresh rates above 144Hz you will have to lower the colour support in one of a couple of ways. This might sound like a big sacrifice, but don’t be too alarmed. Even less so than on the 27″ PG27UQ. We will try and explain.
The easy part here is refresh rates up to 144Hz maximum. That is within the bandwidth capabilities of DP 1.4 without any colour compression being needed, and therefore you can run the screen just like you would any other display. It will support the full resolution, up to 144Hz refresh rate and with 10-bit colour depth support as well if you have a game that can make use of it. As we explained earlier, 10-bit colour depth support is only applicable for gaming on this display given the limitations of NVIDIA GeForce gaming graphics cards, and not for professional applications like Photoshop. This is useful for HDR gaming where 10-bit colour depth is more commonly used and a lot of other games may not even support 10-bit anyway. No colour compression is needed for refresh rates up to 144Hz anyway so 10-bit is there if you need it.
Up to 144Hz =
10-bit, full RGB, no compression needed
If you want to push the screen up to high refresh rates >144Hz then some kind of colour compression is required so that it can fit within the bandwidth capabilities of DP 1.4. There are two ways this can be achieved. We would recommend using option 1 as there’s no need to drop the chroma here on this screen.
1) Drop from 10-bit colour depth to 8-bit – this might not actually make any real difference for many games, especially if they are non-HDR games or just simply don’t support 10-bit colour depth. In a game where 10-bit is supported, or in HDR gaming you may see some improvements in colour gradients when using 10-bit over 8-bit but then again in some cases you may not see much real difference. For >144Hz refresh rates you can drop the colour depth to 8-bit and then not worry about the chroma sub-sampling discussed below.
2) Use Chroma Sub-sampling – this is a method for compressing the colour information in a signal to save on bandwidth, without significantly impacting the picture quality in many cases. This avoids the need to reduce the luminance information (luma) in the signal which would have a more noticeable impact on picture quality, and this method can help reduce the file size by a significant amount.
Above 144Hz inc 200Hz max =
compression needed, either 8-bit or 4:2:2 Chroma

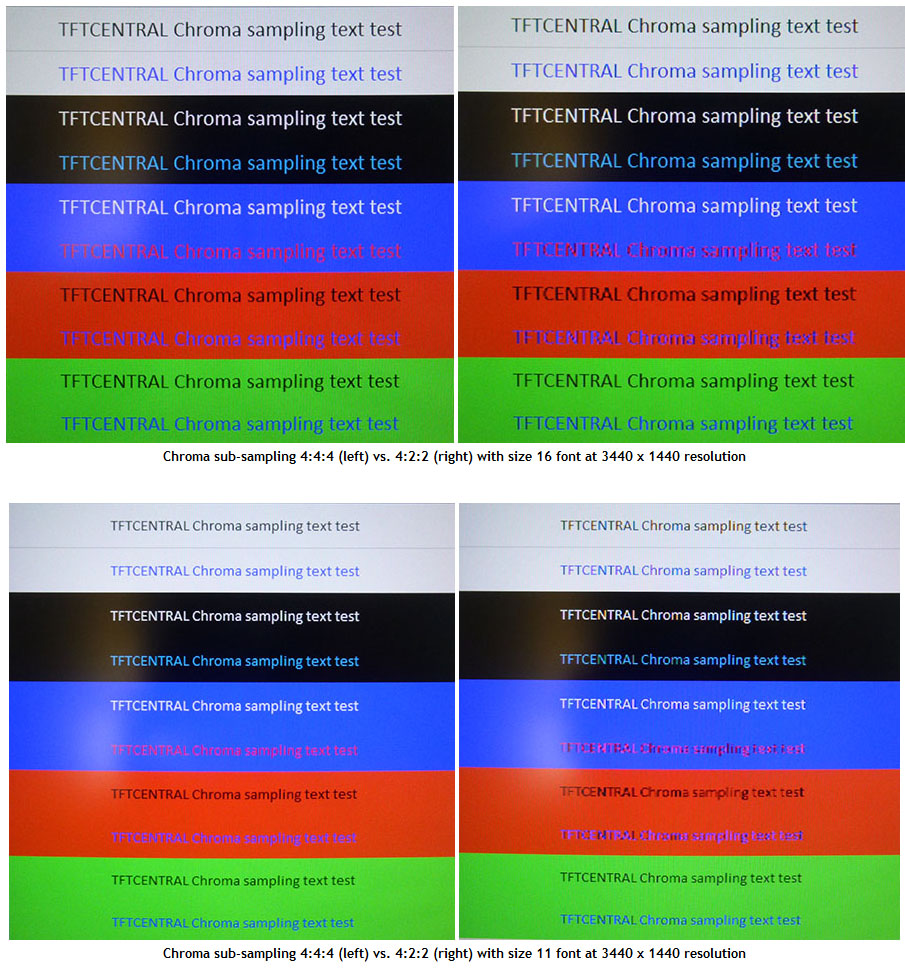
We’re not going to go in to loads of depth about what chroma sub-sampling is here, as it’s not really relevant when you can instead just use 8-bit colour depth. Unlike the PG27UQ model, you’re not forced to use chroma sub-sampling even at the maximum 200Hz refresh rate, so it’s not really as relevant. If you do want to know more about chroma sub-sampling you can read this section of our PG27UQ review for more info. We did test it at 4:2:2 chroma out of interest and saw similar results to the PG27UQ. No change to contrast, colours or overall performance, but an impact to text clarity. The comments we made in the PG27UQ review still apply here around usage in this mode. If you want to see the photos specifically from the PG35VQ at reduced chroma you can do so here (but again there’s no real need to use 4:2:2 on this model).
Does this even matter? Can you reach above 144Hz?
One key thing to keep in mind amongst all this talk of colour compression is the frame rate you’re realistically going to be able to achieve with your system and graphics card when trying to power the screen at this high resolution. Modern HDR capable games are really going to push your system to its limits at this resolution and with high games settings, and so actually achieving high refresh rates above 144Hz might not be easy to achieve, or may even be impossible to many people. So depending on your other hardware this whole section may be somewhat irrelevant, and to many people they can just run the screen at 144Hz maximum refresh rate and have a full 10-bit colour depth and 4:4:4 chroma sampling (uncompressed). Even if you can get above that, dropping to 8-bit with full 4:4:4 chroma maintained seems a pretty good option. Another consideration is whether you’d even want to reach above 144Hz, which brings us on to…
Above 144Hz Refresh Rates and Overclocking


The PG35VQ can also support an overclocked refresh rate of 200Hz if you really want to push the capabilities of the DisplayPort 1.4 connection and be at the bleeding edge of refresh rate and resolution support. You need to enable the overclocked refresh rate in the OSD menu, otherwise the maximum natively selectable refresh rate is 180Hz. The screen reboots and it should then be an available option in the NVIDIA graphics card control panel. We would recommend using the provided DisplayPort cable, or a high quality cable to ensure support and stability for this display. We had no issues enabling or using 200Hz from our test system using the provided cable. As we’ve said above, you need to drop to 8-bit colour depth (of 4:2:2 chroma if you really wanted to) to reach above 144Hz refresh rate due to bandwidth restrictions.
After enabling the 200Hz overclock via the OSD menu and making the necessary setting changes in the NVIDIA control panel we measured the response times again at the optimal ‘normal’ setting. We didn’t measure the ‘Extreme’ mode as visual tests showed that the overshoot was too pronounced, with obvious pale halos on moving objects. With each increase in refresh rate there was a minor improvements in response times compared with what we’d measured at 144Hz. Ignoring the very slow black > grey problem transitions for a moment, the average went from 5.9 > 5.6 > 5.4ms G2G. So some minor improvements thanks to a slightly increased overdrive impulse aligned with the increased refresh rate. Thankfully there was no noticeable overshoot, even at the max 200Hz refresh rate although our oscilloscope showed that a little was starting to creep in. The best pixel response time measured in this small sample set did reach down to 3.5 ms which was very good.
There are two issues with these refresh rates above 144Hz. The biggest is that those transitions from black > grey were still slow, and this is a real challenge even today with the latest cutting edge panel for this VA panel technology. In practice you could still see some black smearing, especially on darker content. It’s similar to pretty much every VA panel we’ve tested in this regard, so do keep in mind that many people are perfectly happy with their VA panel for gaming. It’s not a massive issue, but if you’ve had problems with black smearing on other VA panels before, it is likely to still be apparent for you on this model. This becomes more noticeable with the higher refresh rates due to the increasing frame rate demands.
Secondly the overall response times are not quite fast enough in some places to keep up with the frame rate demands of the screen. You need response times to be consistently and reliably under 5ms G2G to make 200Hz viable, and while the average figure ignoring the very slow transitions here is close to that (5.4ms), some are still a bit too slow. The very slow black > grey figures also have an impact too of course in overall motion clarity. In practice we did see some added motion blurring compared with 144Hz mode when testing 180Hz and 200Hz, although in other ways the image did look a little sharper because of the increased refresh rate. See our pursuit camera photos below to help demonstrate this.
The added blurring was not horrible to be fair, and certainly far better than we’d seen on the other 200Hz VA panel we tested a long time ago, the Acer Predator Z35. On that model the overshoot was too high and it made using anything above about 120Hz difficult. Here on the PG35VQ there was no noticeable or major overshoot all the way up to 200Hz and so this made using the higher refresh rates more pleasant. This seems to be one of the main improvements made when it comes to 200Hz VA panels, the overshoot has been eliminated compared with the older versions which previously made anything above 120Hz a problem.

Above: pursuit camera photos showing real-life perceived motion clarity at different refresh rates
It is still viable to use 144 – 200Hz we felt on the PG35VQ and some people may like it if they can reach the higher frame rates. There are some benefits to the sharpness of the image we felt, but you do get a bit of added blur because of the inability to keep up with that frame rate for all pixel colour transitions. From our pursuit camera photos above you can see that the 200Hz image is a bit sharper, but you get a bit more blurring. For instance behind the red part of the image you get some yellow/orange trailing at 200Hz which isn’t there at 144Hz. There’s also a bit more yellow blurring behind the top part of the UFO image. You can see some of the black smearing at both 144Hz and 200Hz caused by those few very slow response times, especially on the darker background at the top.
I suppose you need to consider whether you’re even going to reach above 144Hz in your games anyway given the resolution and system demands here, as if not this might all be irrelevant. If you do, and you can use G-sync to control the variable refresh rates, it is at least usable on the PG35VQ thankfully. It wasn’t on the Z35 when we tested that in the past. We still felt that 144Hz was probably the optimal upper limit to avoid that added blurring, but up to 200Hz may still be preferred by some.
The slow black > grey transitions even at 200Hz and Extreme OD mode
As a side note and out of interest we thought we’d provide the response time graphs for the troublesome 0 > 50 (black > dark grey) transition.

Above: Normal OD mode at 200HZ. 0 > 50 transition measured
In the ‘normal’ OD mode you can see the slow rise time.

Above: Extreme OD mode at 200HZ. 0 > 50 transition measured
In the ‘Extreme’ mode the overdrive impulse is turned up, and here in this example at 200Hz it’s the most aggressive out of all the refresh rates. The rise time is improved a fair bit, but is still slow overall to reach the desired luminance. This transitions remains one of the problems with VA panel technology even today.
Detailed Response Times – 144Hz Refresh Rate, OD = Normal


Having settled on the ‘normal’ OD response time mode in our earlier measurements and visual tests we carried out a more thorough set of measurements across a wider range of pixel transitions while at the optimal 144Hz refresh rate. The screen is useable at higher refresh rates up to 200Hz, but we felt that the added blurring caused by the mismatch between frame rate and response times reduced motion clarity a bit.
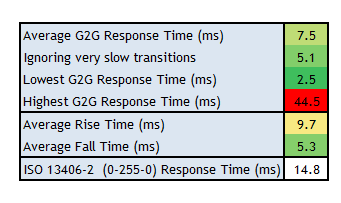
The average G2G figure was measured at 7.5ms overall, or 5.1ms if we ignore the particularly slow transitions which drag the average down. This was with low levels of overshoot that were basically unnoticeable in practice. 73% of the transitions were beneath the 6.94ms threshold needed for 144Hz operation, with several of the others being very close to that figure, and only a few being considerably slower. This meant the screen worked fine at 144Hz.
200Hz Refresh Rate, OD = Normal


We also carried out some more thorough measurements at 200Hz for completeness. You can see that the transitions from black to dark/middle greys was a problem here, which is what leads to some black smearing on moving content. If we ignore those particularly slow transitions in the top row then the average G2G response time was an impressive 4.5ms here overall. 60% of the measured transitions were less than the 5ms threshold needed to make 200Hz useable, but the other 40% were a bit too slow to keep up. There were some low to moderate levels of overshoot on some transitions but nothing that created anything really obvious in practice. The mostly decent overall response times and low levels of overshoot made 200Hz far more usable than the older Acer Predator Z35 which is the only other 200Hz VA panel we’ve tested. We still felt 144Hz was optimal with better overall motion clarity, but Asus have done a nice job speeding up a lot of the pixel response times to at least make 200Hz an option. They even reached down to a very impressive 2ms in the best example!
Gaming Comparisons

We have provided a comparison of the PG35VQ against many other gaming screens we have reviewed, including those in a similar size range and technology. It’s a little tricky to directly compare all these screens as the few very slow transitions on a VA panel can affect the average G2G figure a lot, but it’s the most consistent comparison we can provide between different technologies and models here. The PG35VQ was faster than the other 35″ ultrawide VA panels we’ve tested and maintained pretty low levels of overshoot overall. Some of the high refresh rate IPS type panels were faster, while also being free from the problematic slow black > grey transitions and black smearing in practice which affect VA technology. Some of the high refresh rate TN Film models were faster, but generally showed moderate levels of overshoot as well (e.g. Asus ROG Swift PG278Q = 2.9ms, and Dell S2716DG = 3.1ms)
VA Technology Display Comparison
To try and give a more direct comparison between the different VA models we’ve tested we have produced the following new comparison table below. Each screen is set to the optimal response time setting and refresh rate from our reviews.

You can see that the PG35VQ compares pretty favourably here overall, recording the fastest response times on average. It does show a 60% black smearing level though (explained below) which is pretty high, but thankfully there is little noticeable overshoot at all. This screen can more comfortably handle higher refresh rates, with 144Hz being optimal we felt. Even the max 200Hz is useable on this model (although not perfect), whereas on some of these other models compared, the higher refresh rates are not practical.
To explain the “black smearing” measurement above. The higher the black smearing level (as a %), the worse the screen is in this regard. The “Black smearing level” is determined by looking at the response times along the top row of our measurements which are those changing from black (0) to various grey shades (50, 100 and 150 levels) and white (255).

If we take the response time measurements from the PG35VQ at 144Hz there are 3 transitions which are particularly slow (anything above 15ms is considered too slow) and problematic so in this example 60% of the black transitions are slow here (3 out of 5). If a screen has only 2 very slow transitions its black smearing level would be 40% and so on.
Additional Gaming Features
- Aspect Ratio Control – the screen has 3 options for hardware level aspect ratio control options, with settings for full, aspect and 1:1 pixel mapping offered. The aspect mode is really useful as it will maintain the source device aspect ratio while filling as much of the screen as possible. If you want to directly map pixels you can use the 1:1 mode as well. These modes are particularly important given the 21:9 aspect ratio of the screen, with a lot of input devices being optimised for 16:9 instead.
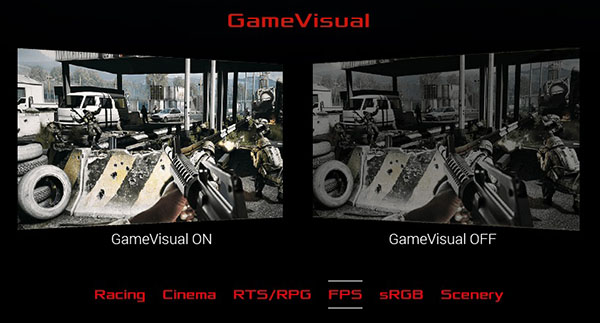
- Preset Modes – There are a quite a few modes available in the ‘GameVisual’ preset mode menu. Accessed via one of the quick access OSD control buttons there are modes for various different uses as shown above. Plenty of different modes to set up and customise for your different uses.
GameVisual offers six display presets, each optimized for a specific usage scenario. These include:
- FPS Mode: Enhanced visibility in First Person Shooter gameplay.
- RTS/RPG Mode: Enhanced color and sharpness in Real-Time Strategy / Role-Playing Games.
- sRGB Mode: Optimized for photos and graphics on your PC.
- Racing Mode: Created for real-time racing and fast gaming experience.
- Cinema Mode: Contrast and color saturation for livelier and vivid visuals during movies.
- Scenery Mode: Increased brightness, contrast gradation plus color saturation tweaks for viewing photographic scenes.
GameVisual offers six display presets, each optimized for a specific usage scenario. These include:
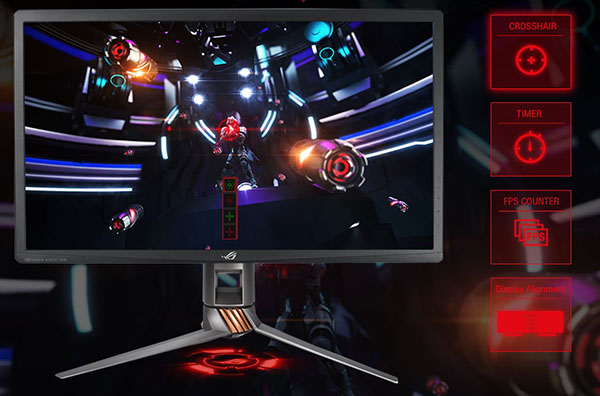
- GamePlus – offers additional overlays to aid and enhance the games you play. As they are built into the display OSD, they can be applied to any game. A countdown timer and aiming crosshair, with options of styles and placements, are available. There’s also an overlay with alignment arrows to aid precise calibration of multi-monitor setups.
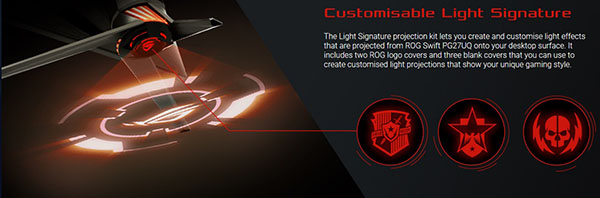
- ROG Light Signature – ROG Light Signature is integrated at the base of the monitor stand and features a downward firing light that casts the ROG logo onto the desktop surface. The plastic inserts can be customized to illuminate clan emblems or other personalized designs. It includes two ROG logo covers and three blank covers that you can use to create customised light projections that show your unique gaming style.
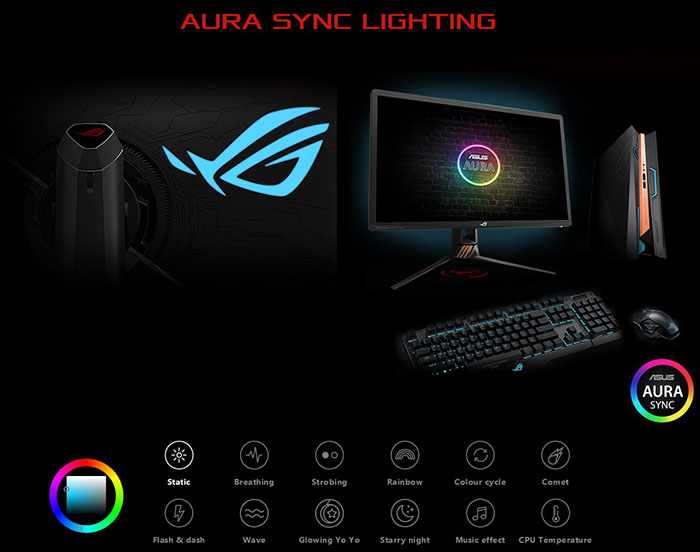
- ASUS Aura Sync – this technology creates immersive ambient lighting and supports synchronization with Aura-enabled components and peripherals. To achieve perfect synchronisation, simply connect ROG Swift PG35VQ to other peripherals by installing the Aura Sync software on your laptop or desktop. Enjoy the coolest and most stylish backdrop for any gaming setup, and have all lights pulsing to the beat of your favourite music or game sound effects. With an eco-system that spans over 100 devices, there’s scope to create a cohesive visual theme from the PC all the way to the desktop and beyond.
- Rear ROG logo lighting – a large ROG logo on the rear of the monitor can be controlled using either the monitor OSD (with several styles of RGB color cycling) or by AURA Sync software via a USB connection to the PC. This allows colors and effects to be synchronized with a range of Aura Sync-compatible hardware.
Lag
We have written an in depth article about input lag and the various measurement techniques which are used to evaluate this aspect of a display. It’s important to first of all understand the different methods available and also what this lag means to you as an end-user.
Input Lag vs. Display Lag vs. Signal Processing
To avoid confusion with different terminology we will refer to this section of our reviews as just “lag” from now on, as there are a few different aspects to consider, and different interpretations of the term “input lag”. We will consider the following points here as much as possible. The overall “display lag” is the first, that being the delay between the image being shown on the TFT display and that being shown on a CRT. This is what many people will know as input lag and originally was the measure made to explain why the image is a little behind when using a CRT. The older stopwatch based methods were the common way to measure this in the past, but through advanced studies have been shown to be quite inaccurate. As a result, more advanced tools like SMTT provide a method to measure that delay between a TFT and CRT while removing the inaccuracies of older stopwatch methods.
In reality that lag / delay is caused by a combination of two things – the signal processing delay caused by the TFT electronics / scaler, and the response time of the pixels themselves. Most “input lag” measurements over the years have always been based on the overall display lag (signal processing + response time) and indeed the SMTT tool is based on this visual difference between a CRT and TFT and so measures the overall display lag. In practice the signal processing is the element which gives the feel of lag to the user, and the response time of course can impact blurring, and overall image quality in moving scenes. As people become more aware of lag as a possible issue, we are of course keen to try and understand the split between the two as much as possible to give a complete picture.
The signal processing element within that is quite hard to identify without extremely high end equipment and very complicated methods. In fact the studies by Thomas Thiemann which really kicked this whole thing off were based on equipment worth >100,1000 Euro, requiring extremely high bandwidths and very complicated methods to trigger the correct behaviour and accurately measure the signal processing on its own. Other techniques which are being used since are not conducted by Thomas (he is a freelance writer) or based on this equipment or technique, and may also be subject to other errors or inaccuracies based on our conversations with him since. It’s very hard as a result to produce a technique which will measure just the signal processing on its own unfortunately. Many measurement techniques are also not explained and so it is important to try and get a picture from various sources if possible to make an informed judgement about a display overall.
For our tests we will continue to use the SMTT tool to measure the overall “display lag”. From there we can use our oscilloscope system to measure the response time across a wide range of grey to grey (G2G) transitions as recorded in our response time tests. Since SMTT will not include the full response time within its measurements, after speaking with Thomas further about the situation we will subtract half of the average G2G response time from the total display lag. This should allow us to give a good estimation of how much of the overall lag is attributable to the signal processing element on its own.
Lag Classification
To help in this section we will also introduce a broader classification system for these results to help categorise each screen as one of the following levels. We will now keep these classifications consistent regardless of the actual refresh rate of the screen being measured:
- Class 1) Less than 8.33ms – the equivalent to 1 frame lag of a display at 120Hz refresh rate – should be fine for gamers, even at high levels
- Class 2) A lag of 8.33 – 16.66ms – the equivalent of one to two frames at a 120Hz refresh rate – moderate lag but should be fine for many gamers. Caution advised for serious gaming
- Class 3) A lag of more than 16.66ms – the equivalent of more than 2 frames at a refresh rate of 120Hz – Some noticeable lag in daily usage, not suitable for high end gaming


We have provided a comparison above against other models we have tested to give an indication between screens. The screens tested are split into two measurements which are based on our overall display lag tests (using SMTT) and half the average G2G response time, as measured by the oscilloscope. The response time is split from the overall display lag and shown on the graph as the green bar. From there, the signal processing (red bar) can be provided as a good estimation.
The total lag measured was only 5.60 ms. With around 3.75 ms of that accounted for by pixel response times (at 144Hz optimal refresh rate), we can estimate there is around only 1.85 ms of signal processing lag, the actual lag you might feel during gaming and other uses. This was basically nothing and in line with even the fastest gaming screens in the comparison above, and as is common for screens featuring the G-sync hardware module instead of a scaler. A great result when it comes to lag from this screen.
Movies and Video
The following summarises the screens performance for videos and movie viewing:
| Category | Display Specs / Measurements | Comments |
| Size | 35″ widescreen | Large for desktop display |
| Aspect Ratio | 21:9 | Can support wider screen content than common 16:9 which is useful for movies |
| Resolution | 3440 x 1440 | Can support native 1080p content, but not quite Ultra HD natively which requires a higher vertical resolution of 2160. |
| HDCP | Yes | Suitable for encrypted content |
| Connectivity | 1x DisplayPort 1.4 and 1x HDMI 2.0 | Useful additional HDMI input for external Blu-ray players or games consoles. Limited video connections due to G-sync module usage |
| Cables | DisplayPort and HDMI | Both provided in the box |
| Ergonomics | Tilt, height. swivel | Good range of adjustments suitable to positioning the screen in a variety of angles for different viewing positions. Easy and smooth to operate with a stable stand for the heavy screen |
| Coating | Light Anti-glare | Provides clear, non-grainy image and avoids unwanted reflections of full glossy solutions |
| Brightness range | 20 – 523 cd/m2 (SDR) | Good adjustment range offered including a higher brightness than many screens. Flicker free backlight operation with no PWM |
| Contrast | 1781:1 after calibration | Very good contrast ratio thanks to the VA panel, although a bit lower than advertised unfortunately. Should be fine for most content and provide good shadow detail in dark content. Can be increased massively by enabling the FALD or in HDR content |
| Preset modes | Cinema | There is a Cinema preset mode which is a bit cooler and brighter than our calibrated mode. It can be easily customised to suit your needs so may be useful |
| Response times | 7.5ms G2G (5.1ms ignoring v slow transitions), with no real overshoot at 144HZ 10.8ms G2G (6.3ms ignoring v slow transitions) at 60Hz with no overshoot (extreme OD mode) | Response times are good overall but you may see some black smearing in some situations due to the slow VA black > grey transitions. Switch up to the ‘Extreme’ OD mode at 60Hz for external devices and Blu-ray players to boost response times, without any noticeable overshoot issues being introduced. |
| Viewing angles | Good | Not as wide as IPS, and fairly typical for a VA panel. Free from the pale “IPS-glow” on dark content when viewed from an angle that you see on IPS panels although some uniformity issues become apparent from an angle on dark content |
| Backlight bleed | Blotchy pale areas without FALD active | Some blotchy areas evident and likely due to the FALD zones. These disappear and the screen offers very deep blacks once FALD is enabled |
| Audio | Headphone output | No integrated speakers on this model, but an ESS Saber ES9118 Hi-Fi headphone AMP is provided |
| Aspect Ratio Controls | Full, aspect and 1:1 modes | Good options to account for non-21:9 format inputs if needed |
| PiP / PbP | Not supported | n/a |
| HDR support | VESA DisplayHDR 1000 with 512-zone FALD backlight | See below |
High Dynamic Range (HDR)
HDR stands for High Dynamic Range and is a technology which has started to become more common in the desktop monitor market, albeit in various different flavours. As a technology it’s been around in the TV market for a few years and is used primarily to provide a better dynamic range and contrast to the image for multimedia, movies and games – that being the difference between light and dark parts of an image. This improvement to the dynamic range is usually paired with other specific features under the banner term of “HDR” including a wider colour gamut for richer, more vivid colours and specs like a 10-bit colour depth support and a high Ultra HD resolution. Overall, an HDR Capable screen is designed to offer a more life-like images, with better contrast ratios between light and dark areas and more vivid, bright colours. You only need to go in to a high street store to observe the difference that HDR makes on TV sets, so we would encourage you to do that if you want to see first hand the improvements it makes to the image quality.
HDR Standards Conformity

The PG35VQ is heavily promoted for its HDR capabilities, and unlike many screens in the market this one does actually live up to the billing. It even carries official certification under the VESA DisplayHDR 1000 standards.
FALD and Blooming Tests

Local dimming is achieved through a 512-zone Full Array Local Dimming (FALD) backlight for the best HDR dimming performance you can currently get from an LCD panel. OLED screens in the TV market can offer superior local dimming at an individual pixel level, but for LCD screens FALD is the preferred method, and the more zones, the better. This means small areas of the screen can be brightened while others are dimmed, and it gives a far better level of control compared with typical edge-lit local dimming options which have far few zones (commonly 8 to 16). Read our HDR article for more information about these methods to achieve local dimming necessary for HDR.

If you connect an HDR source to the screen, it automatically switches in to HDR mode and turns on the variable backlight. There are 3 speeds for the FALD backlight you can switch between when running the screen in HDR mode. Many of the OSD settings become locked when an HDR source is detected, whether that’s from a PC over DisplayPort, or from an external HDMI input like a Blu-ray player or games console. Things like brightness and the GameVisual preset modes are unavailable in HDR mode.
Blooming is something people are concerned about with HDR content, where on darker content you can get a halo or “bloom” around brighter objects. The more direct backlight control there is, and the more dimming zones there are, the more potential there is to reduce this blooming. Even with a 512 zone FALD you will see some blooming around small bright objects on a dark background, and that’s unavoidable. Mouse cursors on dark backgrounds are an unrealistic real-world test and you can spot the blooming around them quite easily. But in real HDR content and multimedia, there were low levels of blooming apparent when running the screen at the ‘medium’ or ‘fast’ variable backlight setting. We ran various dark HDR test videos including this useful night-time Christmas lights video to observe the operation of the FALD and the levels of blooming. The ‘gradual’ setting showed a lot more blooming and areas with brighter highlights seemed to have a much more obvious pale glow areas around them. When you switched to the ‘medium’ mode, or preferably the ‘fast’ mode the pale glow areas were significantly reduced. There was low levels of blooming here thanks to the fast FALD operation, and aided as well by the high native contrast ratio of the VA panel. The performance was better we felt than the PG27UQ with it’s IPS panel and 384-zone FALD we tested last year. Where there are black borders on the image (because it’s a 16:9 aspect ratio source video) that’s where you can see the blooming more clearly, as there is a defined straight edge to where the image ends, and it “spills” over in to that border area. You will also see the blooming more from a wider viewing angles than if you were viewing the screen head on. It’s hard to quantify the levels of blooming on an HDR display, and capturing videos is not very easy as it’s hard to provide a realistic view of what it genuinely looks like in practice to the naked eye, especially when you consider the high contrast and deep blacks of this particular screen. You would need even more local dimming zones in order to make the blooming smaller, but what is available here gives a better local dimming control than normal edge-lit local dimming backlights. Like we said, we felt it was quite noticeably better than the IPS equivalents like the PG27UQ, and that’s probably largely down to the panel technology difference.
This FALD also allows the screen to offer the necessary 1000 cd/m2 peak brightness spec required for the certifications and to provide a great dynamic range contrast in practice. The Quantum Dot coating boosts the colour gamut so that there is a high 88.1% DCI-P3 coverage, and the 8-bit+FRC panel supports 10-bit colour depth too.
HDR Contrast and Peak Brightness
We measured the luminance and contrast performance of the screen in HDR mode in a variety of scenarios. A white box is displayed on the screen which covers 1% of the overall screen size initially. This is designed to show at several target luminance levels, starting at 100 and then changing to 400 and 1000 cd/m2 (and beyond if needed). We measure the actual luminance of that white box to see how close to the target luminance the screen actually performs at each step. When the screen reaches the maximum peak luminance possible, we also measure the black depth of the screen at a point furthest away from the white area. This can then allow us to calculate the HDR active contrast ratio, the difference between the bright white area on screen, and the dark black areas elsewhere.
This 1% white screen coverage is designed to give a rough representation of how a small highlight area in HDR content might appear and work in normal multimedia. The box then increases to a larger size, covering 4, 9, 25, 49 and finally 100% of the screen area. This represents different sized areas of bright content in HDR multimedia. Again those progressively larger boxes are shown at the different luminance targets, and we measure the actual screen luminance achieved for each.
HDMI External Input
Reference White (nits) = default 80
| White window size | 100 cd/m2 target | 400 cd/m2 target | 1000 cd/m2 target | 2000 cd/m2 target | Peak luminance (cd/m2) | Min black depth (cd/m2) | HDR contrast (x:1) | |
| 1% | 113 | 482 | 833 | 865 | 865 | <0.02 | >43,250 | |
| 4% | 109 | 458 | 1104 | 1150 | 1150 | <0.02 | >57,500 | |
| 9% | 103 | 432 | 1053 | 1053 | 1053 | <0.02 | >52,650 | |
| 25% | 104 | 440 | 1048 | 1050 | 1050 | <0.02 | >52,500 | |
| 49% | 106 | 446 | 980 | 980 | 980 | <0.02 | >49,000 | |
| 100% | 107 | 452 | 830 | 830 | 830 | n/a | n/a |
These results were obtained when connecting an external device capable of HDR content over the HDMI interface. This is a simpler setup than using a PC, removing all the complications with Windows, software, graphics cards etc and will give you a representation of the screens behaviour when connecting an external device like a Blu-ray player or Games Console in theory. All sample sizes from 1% to 100% white coverage, the targets for 100 cd/m2, 400 cd/m2 and 1000 cd/m2 were reached quite accurately which was great news.
For some of the brighter content the peak brightness measurement did reach up to a max of 1228 cd/m2 before settling back down to a slightly lower figure after a second or so. We did measure a settled peak luminance of 1150 cd/m2 and a simultaneous black point on the same screen of less than 0.02 cd/m2 (the lower limit for our measurement device). This gives rise to a HDR contrast ratios of over 57,500:1 which was excellent and a long way beyond the normal static contrast ratio of around 1781:1.
Using HDR Complexities
We will repeat what we said in some of our previous reviews here as it’s an important consideration you need to make. We should touch on the complexities of using HDR at this stage though, especially from a PC. It’s actually quite complicated to achieve an HDR output at the moment from a PC and something you should be aware of before jumping straight in to a modern HDR screen.
You will need to ensure you have a compatible Operating System for a start. The latest Windows 10 versions for instance will support HDR, but from many systems you will see some odd behaviour from your monitor when it is connected. The image looks dull and washed out as a result of the OS forcing HDR on for everything. HDR content should work fine (if you can achieve it – more in a moment!) and provide a lovely experience with the high dynamic range and rich colours as intended. However on some Windows 10 versions, normal every day use looks wrong with the HDR option turned on. Windows imposes a brightness limit of 100 cd/m2 on the screen so that bright content like a Word Document or Excel file doesn’t blind you with the full 1000 cd/m2 capability of the backlight. That has a direct impact on how the eye perceives the colours, reducing how vivid and rich they would normally look. It also attempts to map the common sRGB content to the wider gamut colour space of the screen causing some further issues. Sadly Windows isn’t capable at the moment of turning HDR on/off when it detects HDR content, so for now it’s probably a case of needing to toggle the option in the settings section (settings > display > HDR and Advanced Color > off/on). Windows does seem to behave better when using HDMI connectivity so you may have more luck connecting over that video interface, where it seems to switch correctly between SDR and HDR content and hopefully negate the need to switch HDR on and off in the Windows setting when you want to use different content. This is not any fault of the display, and perhaps as HDR settles a bit more we will have better OS support emerge. The latest Windows 10 updates have reportedly improved things somewhat.
That is a little fiddly in itself, but a current OS software limitation. The other complexity of HDR content from a PC is graphics card support. The latest NVIDIA and AMD cards will support HDR output and even offer the appropriate DisplayPort 1.4 or HDMI 2.0a+ outputs you need. This will require you to purchase a top end graphics card if you want the full HDR experience, and there are some added complexities around streaming video content and protection which you might want to read up on further. There are graphics cards now available to provide that HDR option from a PC, but they are going to be expensive right now.
Finally, content support is another complex consideration from a PC. HDR movies and video including those offered by streaming services like Netflix, Amazon Prime and YouTube currently won’t work properly from a PC due to complicated protection issues. They are designed to offer HDR content via their relevant apps direct from an HDR TV where the self-contained nature of the hardware makes this easier. So a lot of the HDR content provided by these streaming services is difficult or impossible to view from a PC at the moment. Plugging in an external Ultra HD Blu-ray player with HDR support is thankfully simpler as you are removing all the complexities of software and hardware there, as the HDR feature is part of the overall device and solution.
PC HDR gaming is a little simpler, if you can find a title which supports HDR properly! There are not that many HDR PC games around yet, and even those that support HDR in the console market will not always have a PC HDR equivalent. Obviously more will come in time, but it’s a little limited at the time of writing.
Where you have everything in place and a decent game that supports HDR, the PG27UQ will offer some excellent performance thanks to the 384-zone FALD with fast operation, high peak brightness and high HDR contrast ratio support. There is wide colour space coverage and 10-bit colour depth offered as well to enhance the colours and appearance of the image further.
The other area to consider here is console HDR gaming. Thankfully that part of the gaming market is a bit more mature, and it’s far simpler to achieve HDR thanks to the enclosed nature of the system – no software, graphics card or OS limitations to worry about here. If you have a console which can output HDR for gaming such as the PS4, PS4 Pro or X Box One S then the monitor will support those over the HDMI 2.0 connection.
None of these complexities are the fault of the display, and we should make it clear that the PG35VQ is certainly capable in itself of a very high level of HDR content support, and will be HDR-ready for you in the future. You just need to be aware of the difficulties in actually getting HDR working from the PC side of things right now and understand that it might limit your uptake of HDR material as a consumer at the moment. The TV market is a simpler space for HDR right now, but although HDR is now emerging in the monitor market, the driving PC content side of things still needs time to catch up and settle.
Conclusion
If you would like to help support our continued work please consider making a donation no matter how small or large. Thank you for the continued support.
The PG35VQ is a very top end gaming display and we will tackle the elephant in the room first – the very high price tag. At the time of writing this review (dated at the top of the page) the screen is available to pre-order in the UK from key retailers like Amazon at a retail price of a whopping £2699.99. Other regions are likely to be comparable price points once it starts to emerge more widely. We will repeat some of what we said when we reviewed the PG27UQ here as it is still very relevant.
Obviously the price of this screen is far beyond most monitors we’ve seen in recent years, but this isn’t a case of manufacturers just ripping off customers for the fun of it (and profits). This is a bleeding-edge screen when it comes to technology, features and specs. Many of the components are very expensive (including the FALD and G-sync module), and the amount of R&D that went in to producing it, getting it working, and optimising it for release is massive. It’s firmly positioned as a premium gaming screen and Asus aren’t expecting it to be suitable or available to the mass volume market. While it might be excessively priced and out of range of many gamers, there are certainly people out there who invest huge amount of money on the latest gaming hardware, play very high end professionally or just have the disposable income to invest their hard-earned money in new technology like this. The high end gaming market is more accepting of super high end products and high pricing, and these are the kind of gamers who will happily spend $800 – 1000 on the latest graphics cards, not to mention other PC components to give them the most powerful and best system for gaming they can buy. That’s really where the PG35VQ (and smaller 27″ PG27UQ before it) are going to sit in the market. It’s never going to be accessible to a large part of the consumer base, but that’s not to say that it won’t still be an option to some people.
With that out of the way, we really enjoyed testing this screen as it has all kinds of specs and features which are pushing the capabilities of desktop monitors today. This is the larger brother to the 27″ PG27UQ and gives gamers and option if they prefer either the ultrawide aspect ratio, the larger screen size, or if they prefer VA panel technology to IPS. There’s no denying that the larger 35″ screen size and ultrawide aspect ratio adds to immersion in gaming, and is also far more suitable for videos, movies and multimedia. It gives you more desktop real-estate to play with for other uses too (once scaling is considered on the 27″ model). It might not have a full 4K resolution and so the image isn’t quite as pin-sharp, but the 3440 x 1440 res provided is also far easier to use than the 3840 x 2160 of the 27″ model. You don’t need to worry about OS and software scaling or the complications that can create, and it’s also a little less demanding on system resources for gaming. It was really pleasing to see this resolution on the 35″ screen as opposed to lower resolutions like 2560 x 1080 that we’ve seen in the past.
The VA panel technology has its good and bad points as a technology, and compared with the IPS panel of the PG27UQ, a lot of which should be fairly well known to those who’ve used both technologies before or have read about them enough. On the negative side the main challenge with this technology is still the slow black pixel response times, which in practice create some black smearing on moving content. That is something that affects nearly every VA panel, and unfortunately it was still evident here to a moderate level. Asus have done a nice job of speeding everything else up though, while at the same time avoiding any major overshoot problems – another common problem with VA panels when they get pushed to faster response times. Overshoot isn’t an issue here, and response times are just about fast enough to even make the 200Hz max refresh rate usable and viable. We preferred the motion clarity at up to 144Hz as you do get a bit of added blurring above that, so it’s certainly not perfect for all refresh rates. But it is better than previous efforts at super-high refresh rate VA panels we’ve seen. The ability to offer 3440 x 1440 at refresh rates beyond 100/120Hz is also unique in the market right now, so that’s something else that separates this screen from competitors. We were pleased to see you don’t have to make any chroma sacrifices to reach the upper refresh rates, as we know that bothered some people with the PG27UQ. Having to drop to 8-bit colour depth is less of an issue. The presence of G-sync, the low input lag, the wide gamut support and the range of gaming extras provided were also positives.
Viewing angles of VA are not as wide as IPS and you do get more colour tone and contrast shift as a result. This panel didn’t offer as high a colour gamut as the PG27UQ either, although it was sufficient just about to meet the required DCI-P3 gamut specs. On the plus side this technology is far more suited to dark content and can produce much lower black depths and better contrast ratios. The 1781:1 calibrated contrast ratio was far higher than any competing IPS or TN Film panel, although it was a little lower than we had perhaps hoped. This was without the FALD active though, and once that was enabled the contrast ratios were incredible. You could reach very low black depth of <0.02 cd/m2 even where the screen was showing bright content in places up to over 1000 cd/m2. For HDR content (or even SDR with the FALD enabled) you could achieve a very pleasing result and a vastly improved dynamic range. The high contrast panel and well tuned FALD operation helped keep blooming to a minimum even on small highlight areas, and it looked better than what we’d seen on the 27″ PG27UQ before. Being a VA panel, it is also free from the off-angle pale IPS-glow you get from many IPS panels.
Overall from a technical and performance point of view it’s a very good screen. Not without a few faults and limitations, but in many areas it far surpasses what the competition can offer right now. We think this is probably going to fall in to a niche for those who want a premium HDR experience for either gaming or movies, with proper FALD in a desktop monitor and solid performance. That’s definitely a strength of this model. The other niche is for those who want a larger and wider version of the PG27UQ and have the cash to spend on what is an expensive, but very decent display. The PG35VQ is available in most regions via Amazon (affiliate links).
| Pros | Cons |
| Strong gaming experience with no overshoot, G-sync availability, high refresh rate and very low lag | Some black smearing still an issue on moving content |
| Excellent HDR experience with low levels of blooming, high contrast ratios and high peak brightness | Pixel response times not quite fast enough to keep up with >144Hz, although up to 200Hz is still usable |
| Unique specs like 3440 x 1440 @ 200Hz, with wide gamut and FALD backlight | Very high price point |

| Check Availability and Pricing – Affiliate Links |
|---|
| Amazon |
| TFTCentral is a participant in the Amazon Services LLC Associates Programme, an affiliate advertising programme designed to provide a means for sites to earn advertising fees by advertising and linking to Amazon.com, Amazon.co.uk, Amazon.de, Amazon.ca and other Amazon stores worldwide. We also participate in a similar scheme for Overclockers.co.uk. |
We may earn a commission if you purchase from our affiliate links in this article- TFTCentral is a participant in the Amazon Services LLC Associates Programme, an affiliate advertising programme designed to provide a means for sites to earn advertising fees by advertising and linking to Amazon.com, Amazon.co.uk, Amazon.de, Amazon.ca and other Amazon stores worldwide. We also participate in a similar scheme for Overclockers.co.uk, Newegg, Bestbuy , B&H and some manufacturers.