Comparing OLED and LCD Brightness and Exploring Samsung Display’s TrueBright Certification
Disclaimer: this article includes sponsored promotion, but all content, opinions and commentary are our own.
Introduction
The brightness capabilities of OLED displays has been a hot topic for many years now as this panel technology continues to take over the display markets, whether that’s monitors, TV’s, laptops or various other display devices. Increases in specs for both SDR and HDR content continue to be made, while being balanced by panel and display manufacturers against any concerns or challenges with panel longevity, image retention and burn-in. This has included major steps forward for TV specs this year such as with Samsung Display’s 2025 QD-OLED technologies which can reach 4000 nits peak brightness for HDR, and some recent enhancements for QD-OLED monitor panels this year too allowing them to make a step up in brightness performance.
Despite improvements some people are put off by the apparent low specs and measurements they see advertised. For example, some people may be using a 400 nits or 500 nits rated LCD monitor at high brightness settings and therefore be concerned about the advertised 250 – 300 nits spec of most OLED monitors. Typical 250 nits-rated OLED monitors tend to reach around 270 nits maximum in SDR based on our wide range of testing, but is this enough for you? Is it bright enough? Is it really a lot darker than LCD monitors?
This article will explore this topic in detail, as well as taking a look at a new certification process that is designed to help consumers understand the real-world brightness of OLED technologies better. We’ve also provided a TL;DR summary at the end for those who don’t want the detail – we would of course encourage you to read through all the info provided to get a full understanding of the situation.
Luminance vs. Brightness
For the purposes of this article and display analysis, we need to make a distinction between the terms ‘luminance’ and ‘brightness’. These two terms are often used interchangeably in the industry, but there is a difference that is particularly important to understand as you read through this article.
- ‘Luminance’ is a value measured by an instrument of the luminous intensity of light emitted from a light source, with the familiar unit of measurement being cd/m2, or commonly in nowadays, ‘nits’. This luminance measurement has been used to show through simple measurements what the brightness capabilities of a display are, and is a physical measurement.
- ‘Brightness’ refers to what a person perceives, feels and experiences when light hits the retinal rods and cones. Since it is usually a subjective evaluation, it is more difficult to measure and quantify than luminance is, but it represents the degree of brightness and darkness that a person actually feels. Perceived brightness is influenced not only by the luminance of the display, but also by other factors such as the contrast of the image along with the colourfulness and vividness of the colours.
Quantifying the Perceptual Brightness of Displays
In this article we want to explore an interesting topic, and that is how we might quantify and compare the perceived brightness of different displays and different panel technologies like OLED and LCD. In a previous article we’ve looked in detail at the impact of colour luminance and colour vividness on how colours are perceived and their brightness, but here we want to think more broadly about the perceived brightness of an image.
- Further related content: Exploring OLED Brightness – Improvements, WOLED vs QD-OLED and the Need for New Metrics and Specs
Anecdotally, in the past we’ve noticed that using an OLED monitor side by side with an LCD monitor, with both screens measured and configured to the same test situation luminance levels, can lead to noticeably different perceived brightness of the image. Despite the matching luminance reading from our meter the OLED monitor looks brighter to the naked eye. At Computex this year I had chance to get together with Tim from Monitors Unboxed to record an hour-long podcast for the Hardware Unboxed Podcast channel [watch here], and during that discussion he noted the same.
Why is that? Why do we perceive one display to look brighter than the other?
When contrast is higher, our eyes perceive it as brighter
The answer lies in the contrast of the display. Human eyes perceive brightness differently due to contrast between different areas of the image, even on something as simple as a white box on a plain black or grey background. This is referred to as the “Bartleson-Breneman effect” and it happens because the human visual system interprets differences in brightness relative to the surrounding environment.
Consider the below simple image for example – which white square looks brighter?

Both white squares are actually the same luminance but your eyes (should) see the white box on the left as appearing brighter due to the darker surrounding area and the higher contrast that creates.
To account for the contrast of an image we need a way to measure and compare the perceived brightness, not just the basic luminance measurement.
Perceptual Contrast Length (PCL)
Usefully there is already a defined way to measure the perceived brightness of a display using a measure called ‘Perceptual Contrast Length’ or ‘PCL’. This was defined by SEMI (Semiconductor Equipment and Materials International) in SEMI D75, an industry association representing more than 2,500 semiconductor and display companies globally. SEMI plays a crucial role in reviewing and establishing international standards related to the semiconductor and display industries.
The following equation explains how PCL is calculated:

This takes into account both physical light emissions and the contrast of a display. We can use PCL to compare the scores of two example 300 nit displays for instance below. You can see here that the PCL score is higher for the OLED panel, thanks to the higher contrast:
| OLED Luminance | OLED Brightness | LCD Luminance | LCD Luminance | |
| White | 300 | 281 (QWHITE) | 300 | 281 (QWHITE) |
| Black | 0.0005 | 2 (QBLACK) | 0.2 | 40 (QBLACK) |
| PCL | 279 | 241 |
According to PCL, at the same luminance
OLED is perceived brighter than conventional LCD
due to deeper true black
- Note that the LCD example here assumes it has a contrast ratio of 1500:1 which sits somewhere between a typical IPS and a VA monitor panel, and we’ll talk more about the impact of different LCD technologies later on.
- Also note that you can’t directly compare the actual PCL scores to say how much brighter one is than the other, you have to instead figure out what luminance would be needed to get to the same PCL score. We’ll provide loads more comparisons later for this. For now the point is that at the same luminance measurement, an OLED panel ends up with a higher PCL score and looks brighter than the LCD due to its higher contrast.
‘TrueBright’ Certification

With a method available to calculate and compare perceived brightness in displays, Samsung Display (the panel manufacturer) have recently introduced a marketing claim and certification which they call “TrueBright”. Not to be confused with “True Black” which is a term used in VESA’s certification scheme for HDR performance. Also not to be confused with “TrueBlack” (no space) which was introduced by Asus recently for their new glossy panel coating. It looks like we may have to avoid using the shortened “TB” acronym now, as it could get a little confusing with all these various terms. Anyway, back to “TrueBright” certification…
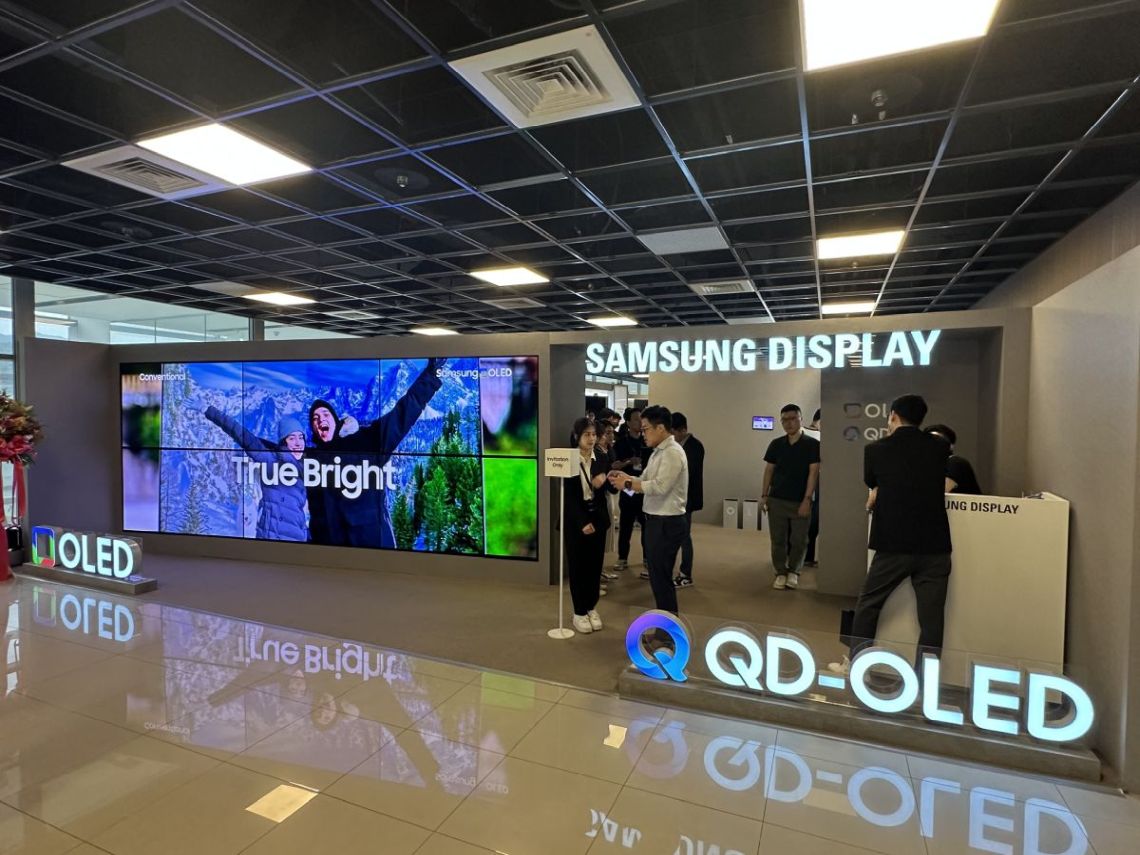
Evaluated and backed by UL Solutions

As explained above, Samsung Display point out that the human eye perceives OLED displays to be much brighter than a conventional LCD display rated to the same brightness thanks to its improved contrast.
You don’t have to just take Samsung Display’s word for it, they have also earned independent “Marketing Claim Verification” from global safety science company UL Solutions, which marks the first time UL Solutions has issued a Marketing Claim Verification for a technology that leverages PCL calculations.
22 OLED Panels independently tested and compared
To support the claims UL Solutions evaluated 15 of Samsung Display’s OLEDs for laptops, tablets, and automobiles, and 7 of its QD-OLED panels for monitors and TVs. We’ll talk about the actual differences and perceived brightness comparisons in a moment, but UL Solutions verified Samsung Display’s claim that its OLEDs and QD-OLEDs provide greater perceived brightness than LCDs of the same luminance.
Testing Methodology

Calculations are carried out in a similar way to how luminance and contrast would traditionally be measured and compared on displays. A white test pattern representing 10% APL area, as specified in SEMI D75-0524, is used (left) to calculate the white luminance, while a black test pattern with white corner boxes is used (right) to calculate black luminance. Measurements are taken in dark room conditions with the screen running in HDR mode.
You may have noticed earlier that the black depth for the OLED panels has been set at 0.0005 nits, as opposed to 0.0000 nits to represent a 100% true black. That has been set in that way due to measurement device minimum luminance limitations and the need for UL Solutions to be able to measure and validate the data for certification. The black luminance spec for VESA’s ‘DisplayHDR True Black’ is set to this level as well for the same reasons. The 0.0005 nits black depth results in a very low QBlack = 2 anyway, although it could just as easily be QBlack = 0 if we assumed a true 0.0000 nits black depth.
UL Solutions Validate OLED Brightness Benefits
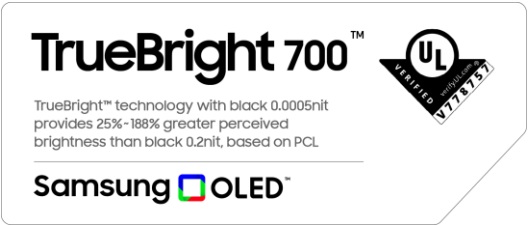
After their independent testing, UL Solutions said Samsung Display’s OLED panels can appear between 25% and 188% brighter than conventional LCD panels thanks to their significantly higher contrast. That’s a broad range that applies across all the tested panels of different display applications and at a range of luminance levels. They also said that on average from their testing the OLED panels offer a perceived brightness that’s around 1.5x higher (50% higher) than that found on an LCD display of the same luminance spec.
On average OLED panels provide 50% higher
perceived brightness than conventional LCD panels
Samsung Display have created logos for TrueBright that reflect these findings and that can be used with their OLED technology (laptop and automotive) and QD-OLED technology (monitor and TV) panels which explain that an OLED display can provide 25% – 188% greater perceived brightness than conventional LCD panels.
Those labels themselves just explain simply that OLED panels can look brighter than traditional LCD panels using this PCL score approach, although the range of between 25 – 188% is broad.
Comparing Perceived Brightness Scores
The most interesting part of considering PCL scores in this way is how we can then use this to compare the perceived brightness between different display technologies. We know an OLED display will look and feel brighter than an LCD of the same luminance measurement/spec, but by how much? What does a 250 nit spec OLED display equate to when comparing with an LCD for example?
| OLED Luminance Spec (nits) | PCL score | Equivalent conventional LCD luminance (nits) | OLED % higher brightness | TrueBright Certification Tier |
| 100 | 222 | 227 | 127% | TrueBright 200 |
| 200 | 256 | 374 | 87% | TrueBright 300 |
| 250 | 269 | 443 | 77% | TrueBright 400 |
| 270 | 273 | 469 | 74% | TrueBright 400 |
| 300 | 279 | 510 | 70% | TrueBright 500 |
| 400 | 296 | 640 | 60% | TrueBright 600 |
| 500 | 310 | 767 | 53% | TrueBright 700 |
| 600 | 322 | 891 | 49% | TrueBright 800 |
| 700 | 333 | 1013 | 45% | TrueBright 1000 |
| 800 | 343 | 1133 | 42% | TrueBright 1100 |
| 900 | 351 | 1253 | 39% | TrueBright 1200 |
| 1000 | 359 | 1371 | 37% | TrueBright 1300 |

From this table and graph you can see the relationship between OLED and conventional LCD panels, as measured and verified by UL Solutions. These results come from testing across a range of different Samsung OLED and QD-OLED panels for different devices. Those in the top half of the table up to around an OLED luminance of 500 nits (meeting HDR 500 True Black certification for with luminance of 500 nits at 10% APL in HDR) can be considered for monitor panels, with the higher luminance examples more applicable for laptop and TV panels which can reach higher luminance under these test conditions.
We’ve included the data for a 250 nits luminance which is the common SDR luminance spec for QD-OLED monitors at the moment, as well as 270 nits which is a typical real-world SDR luminance we’ve seen from our testing of these screens. There’s also 300 nits which represents the newest higher-brightness QD-OLED monitors starting to emerge.
Samsung Display’s 250-nit OLEDs have the same
perceived brightness as 443-nit LCDs
That’s quite a significant difference. You can see from this table that the OLED panels end up being between 37% and 127% brighter than an LCD of the same luminance, and on average based on these examples they are 63% brighter across these examples. It’s at the lower luminance levels where the most significant difference is seen.
Samsung Display’s 300-nit OLEDs have the same
perceived brightness as 510-nit LCDs
Note that the “25 – 188% greater perceived brightness” range listed on the TrueBright logos corresponds to results where the luminance is within the 50 to 2000 nits range, applicable for other OLED device types like in the automotive space, but not as relevant for our target monitor market.
Remember, that this is based on an example typical conventional LCD panel which has a contrast ratio of 1500:1. For the monitor space that sits somewhere in between an IPS panel (~1000:1) and a VA panel (~3000:1). Using a conventional LCD panel of this performance provides a simple mid-ground to demonstrate the typical, common differences and support the TrueBright principles. We can consider the impact of different panel technologies and contrast ratios more in a moment out of interest. For the purposes of the TrueBright certification scheme and promotion, a typical baseline example needs to be established to avoid it becoming very complicated.
TrueBright Logos
Further to the general TrueBright logos like those above, Samsung Display have also introduced specific tier logos set at incremental brightness levels like TrueBright 500, 600, 700 and so on. Those are shown below:

These labels could be used with panels of a certain luminance performance to show what their corresponding TrueBright score would be. So for instance a 250 nits spec OLED panel would receive the TrueBright 400 logo (equivalent to a 443 nits conventional LCD) while a 300 nits OLED panel would receive the TrueBright 500 logo (equivalent to a 510 nits conventional LCD).
Panel technology has an impact
As we alluded to earlier, the actual LCD panel tech you’re comparing an OLED against will have an impact on perceived brightness. An OLED compared with technologies with a lower contrast ratio and weaker black depth like TN Film and IPS (typically ~1000:1 contrast ratio) will end up looking even brighter than if you were comparing that same OLED against a VA panel with a higher contrast and stronger black depth (typically ~3000:1). The larger the difference in contrast ratio, the larger the difference in perceived brightness and the associated PCL scores.
The TrueBright certifications and data shown earlier are based on an LCD with a 1500:1 contrast ratio. If you were considering a lower contrast ratio LCD then the differences would be even more significant, but if you were considering a higher contrast ratio LCD the differences would be less.
Here’s some comparisons of perceived brightness when considering those different LCD panel technologies:
OLED vs. IPS/TN Film LCD – perceived brightness comparison
Here’s the same data table as earlier, but comparing an OLED panel to a typical IPS or TN Film LCD panel with a 1000:1 contrast ratio:
| OLED Luminance Spec (nits) | PCL score | Equivalent conventional LCD luminance (nits) | OLED % higher brightness |
| 100 | 222 | 262 | 162% |
| 200 | 256 | 420 | 110% |
| 250 | 269 | 493 | 97% |
| 270 | 273 | 523 | 94% |
| 300 | 279 | 565 | 88% |
| 400 | 296 | 702 | 76% |
| 500 | 310 | 835 | 67% |
| 600 | 322 | 965 | 61% |
| 700 | 333 | 1093 | 56% |
| 800 | 343 | 1218 | 52% |
| 900 | 351 | 1342 | 49% |
| 1000 | 359 | 1464 | 46% |
You can see that when compared to a lower contrast ratio LCD with 1000:1 the perceived brightness difference is greater. Note that we can’t assign TrueBright certification tiers as those are set specifically for the standard example (1500:1 contrast ratio LCD). It’s interesting to see the equivalent LCD luminance though here.
If you are using an IPS LCD that is capable of ~500 nits luminance and has a typical 1000:1 contrast ratio spec, then based on PCL calculations an OLED monitor which reaches ~250 nits luminance would provide the same perceived brightness in the test environment defined. We’ll discuss some caveats and considerations later by the way.
OLED vs. VA LCD – perceived brightness comparison
Here’s the same data table as earlier, but comparing an OLED panel to a typical VA LCD panel with a 3000:1 contrast ratio:
| OLED Luminance Spec (nits) | PCL score | Equivalent conventional LCD luminance (nits) | OLED % higher brightness |
| 100 | 222 | 185 | 85% |
| 200 | 256 | 317 | 59% |
| 250 | 269 | 380 | 52% |
| 270 | 273 | 405 | 50% |
| 300 | 279 | 442 | 47% |
| 400 | 296 | 563 | 41% |
| 500 | 310 | 682 | 36% |
| 600 | 322 | 798 | 33% |
| 700 | 333 | 914 | 31% |
| 800 | 343 | 1028 | 29% |
| 900 | 351 | 1142 | 27% |
| 1000 | 359 | 1254 | 25% |
You can see that when compared to a higher contrast ratio LCD with 3000:1 the perceived brightness difference is less. Note again that we can’t assign TrueBright certification tiers as those are set specifically for the standard example (1500:1 contrast ratio LCD). It’s interesting to see the equivalent LCD luminance though here.
If you are using a VA LCD that is capable of ~400 nits luminance and has a typical 3000:1 contrast ratio spec, then based on PCL calculations an OLED monitor which reaches ~270 nits luminance would provide the same perceived brightness. We’ll discuss some caveats and considerations later.
Our own testing and observations

When we saw TrueBright being demo-ed at Computex 2025, there were two tests set up. At the top was a convention LCD panel (an IPS with 1000:1 contrast ratio) compared with a QD-OLED panel showing a white on black test pattern. Measurement devices were set up to measure the white luminance of the white area and lighting was controlled as much as possible in the booth area, although it wasn’t a fully dark room. At the bottom were two laptop panels showing a “real-world” image with the measurement devices set in the top area to capture the luminance of a bright part of the image.
- In the QD-OLED monitor panel comparison at the top, the two screens looked very similar in brightness to the naked eye. Checking the measurement devices revealed though that the LCD was outputting 268 nits while the QD-OLED only 99 nits. A good example of how in person the two can end up looking very similar despite the much higher luminance reading of the LCD. This aligns with earlier data comparing PCL scores as well
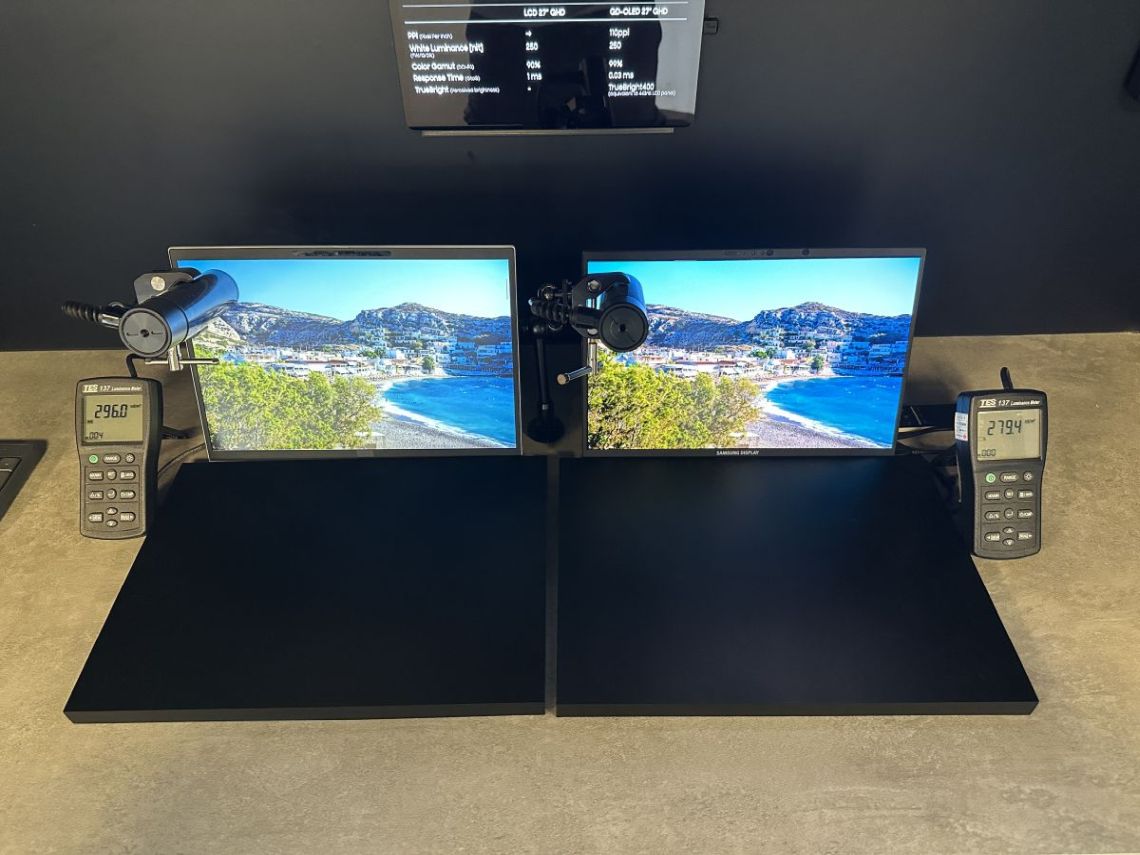
- In the laptop at the bottom the left hand conventional laptop was measured at 296 nits while the OLED panel was measured at 279 nits. These were designed to be pretty close to each other, and even though the conventional panel showed a slightly higher luminance, the OLED panel ended up looking brighter in person. There was more detail and definition to the image thanks to the higher contrast ratio too.
On our own test bench we had chance to set up a range of different panel options and compare brightness too, playing around with various scenarios and configurations. Here’s a good example of a QD-OLED panel (left) compared with an IPS LCD (right), showing a 10% APL white on black test pattern in a dark room. And yes, this really does highlight how much better the contrast and black depth is on an OLED panel when compared side by side with an IPS!

The QD-OLED panel was configured to 200 nits luminance as measured by our calibration device. Starting at 0% brightness adjustment we then manually increased the brightness on the IPS LCD until we felt that the two white sample boxes were of a similar brightness level. It takes some time for your eyes to adjust and balance but we stopped when we felt they looked very similar visually. We then measured the luminance on the LCD and found it had reached ~395 nits.
This was a fairly simple test scenario, but the point really is that the luminance measurements alone would suggest that the LCD is almost twice as bright as the OLED, when in fact they look very similar in this test. This supports the discussion above and demonstrates the Bartleson-Breneman effect again.
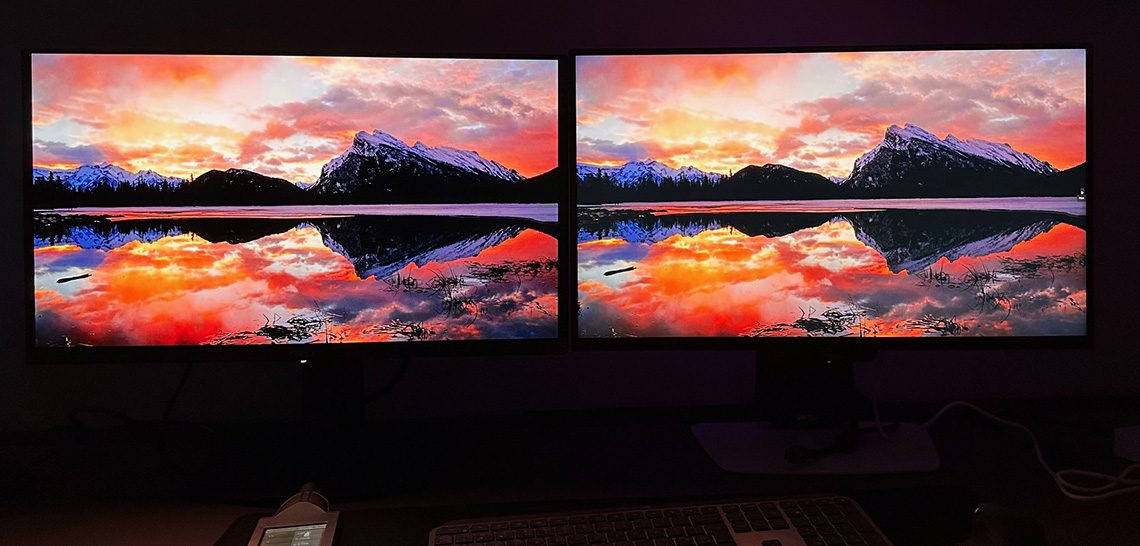
In the above example of a more “real-world” image, both screens were configured to the same luminance of 200 nits. You can hopefully tell this from the photo here as well, but the QD-OLED panel ended up looking brighter than the LCD, despite the matching luminance level. The significance is not as drastic as a full contrast black/white test scenario, but it’s still visible in this test, as it had been with the laptop tests at Computex that we’d seen.
Caveats and considerations for real-world usage
In real-world content, perceived brightness differences will vary
Most of the data and comparisons between OLED and LCD panels discussed above are based on specific test situations using what would be considered the maximum possible contrast situation – that being measurements of white vs. black. This is the same approach that’s used today to measure and compare screens when it comes to luminance, black depth and contrast ratio anyway, so it’s a good base to use. The principles around TrueBright are about converting those traditional measurements in to something that more closely represents the perceived brightness of a display, accounting for all the measures at the same time in a more meaningful way and accounting for improvements in panel technologies.
In real-world content the difference in perceived brightness will vary depending on the colours, shades and contrast of the image. This then starts to become far more complicated to measure and compare as there’s a lot of variables.
A more extreme example would be if you were using full screen office documents like Word of Excel, or even if you were just comparing a full screen white image. In that scenario there is little or even no dark areas, and so no contrast is created. In the example of a full white image, an OLED and an LCD set to the same luminance level would look the same.
The take home point is that the improvements in perceived brightness are greater when the contrast of the image is higher. It could be as low as 0% difference in the extreme example of a full white screen, or as high as 188% difference in the most extreme examples (based on UL Solutions testing of a wide selection of panels and different luminance levels). The brightness benefit will vary depending on the content you view, but the improvements in contrast that OLED panels offer makes a significant difference in many real-world scenarios as well.
Quantifying that is a lot more difficult, and so the TrueBright testing scenarios and certification process are the best approach we have right now and align with existing testing methodology and measurement approaches.
Benefits in real-world situations are also impacted by colours
Linked to the points above about real-world content, QD-OLED panels have a very wide colour gamut and high colour volume thanks to their use of Quantum Dot coating and a true additive RGB approach. Linking back to our previous studies about XCR scores, an OLED panel will look brighter and more vivid for colours than many conventional LCD’s if those LCD’s also have a smaller colour gamut and weaker colour performance. In the LCD space there are many panels which are only standard gamut ~sRGB, which in real-world content will have another impact on perceived brightness.
Things get complicated when considering HDR
This scheme attempts to provide a simple way to compare different panel technologies beyond just basic luminance or contrast ratio measurements. It’s most simple for SDR content, as things become very complicated when it comes to HDR unfortunately.
The core principles still hold true, the Bartleson-Breneman effect still applies and panels with a higher contrast ratio will end up looking brighter to the user. The TrueBright tiers also hold true based on the specific, defined test conditions, so we can refer back to our earlier table again:
| OLED Luminance Spec (nits) | PCL score | Equivalent conventional LCD luminance (nits) | OLED % higher brightness | TrueBright Certification Tier |
| 100 | 222 | 227 | 127% | TrueBright 200 |
| 200 | 256 | 374 | 87% | TrueBright 300 |
| 250 | 269 | 443 | 77% | TrueBright 400 |
| 270 | 273 | 469 | 74% | TrueBright 400 |
| 300 | 279 | 510 | 70% | TrueBright 500 |
| 400 | 296 | 640 | 60% | TrueBright 600 |
| 500 | 310 | 767 | 53% | TrueBright 700 |
| 600 | 322 | 891 | 49% | TrueBright 800 |
| 700 | 333 | 1013 | 45% | TrueBright 1000 |
| 800 | 343 | 1133 | 42% | TrueBright 1100 |
| 900 | 351 | 1253 | 39% | TrueBright 1200 |
| 1000 | 359 | 1371 | 37% | TrueBright 1300 |
So, in theory an OLED monitor which can reach 500 nits luminance (at 10% APL as per the methodology) in HDR will look visually the same as a conventional LCD (with 1500:1 contrast ratio) that reaches 767 nits in the same test conditions. The OLED would therefore earn the ‘TrueBright 700’ certification tier.
However, things start to become complicated for HDR as you have to consider the impacts of various factors. That includes any edge-lit or full-array / Mini LED local dimming that may or may not be present on an LCD. Those could potentially improve contrast if they are decent enough, especially something like Mini LED dimming. That would alter the black depth and contrast ratio significantly, therefore impacting the difference between the two screens. Those same dimming capabilities are rarely used or available in SDR operation. On the other hand LCD local dimming could also lead to challenges with blooming and halos, which you don’t get at all on an OLED.
You’d also have to consider the variations related to the APL of the image, with peak brightness dropping on an OLED as the APL increases and the scene gets brighter, but not in the same way on an LCD. The TrueBright comparisons are based on a 10% APL test scenario, but the OLED won’t reach that same level of luminance for other APL. On the other hand SDR usage is generally uniform on OLED monitors, with no variation in luminance at different APL.
You’d have to consider colour gamut, colour vividness and all kinds of other variables which isn’t really practical within this scheme. HDR content is designed for wide colour gamut and the capabilities vary across different technologies considerably, whereas SDR is standard sRGB colour gamut and so that keeps things consistent when comparing two SDR screens.
As a result of all this, comparing HDR performance and brightness between different displays is far more complicated and we’d advise caution when trying to compare different displays based on TrueBright scores.
Ambient lighting will have an impact, but is complicated
The testing methodology used here calls for a dark room environment for testing. We know that in real-world usage your ambient lighting can have an impact on black depth and contrast ratio. This is again too complicated to work in to the model, as it will depend on the panel technology being compared, the panel coating, and the brightness and positioning of ambient light sources. There’s too many variables to build in to a model like this, and measurement standards are nearly always based on dark-room environments to avoid these complications. While the raising of blacks on QD-OLED panels in brighter rooms is well-documented and will have an impact on contrast, and therefore perceived brightness, don’t forget that we see similar challenges with LCD technologies and matte anti-glare coatings. When using the screens in a well lit room, the perceived brightness differences may not be as substantial.
TrueBright certification applies to OLED panels, not displays
Note that the certification and marketing claims around TrueBright apply to the OLED panels themselves, not to any particular monitor or TV. It’s based on the fact that OLED panels offer a higher contrast than traditional LCD panels, and so the same principles could apply therefore to competing OLED panel technologies – although given TrueBright is a Samsung Display certification, don’t expect to see that same branding adopted by other panel manufacturers. It will be used across Samsung Display panel products whether that’s their QD-OLED (monitors and TV’s) or OLED (laptops, automotive etc) variants.
The same benefits do apply though for other competing OLED technologies which have the same contrast ratio and black depth advantages. When you factor in alternative panel structures and coatings and the way they handle ambient lighting, in real-world scenarios the benefits could be even more noticeable.
Display Manufacturer Adoption
There’s no reason why display manufacturers can’t adopt the certification, branding and logos with their QD-OLED displays and we think this could be a simple and useful tool to explain to buyers how perceived brightness can differ between different panel technologies. It moves things a bit beyond just plain luminance and contrast ratio specs, the latter of which are pretty meaningless on OLED panels anyway. People rely on luminance specs to try and understand the brightness of a display at the moment, but it’s not giving you a full picture of perceived brightness at all. TrueBright can help articulate the difference when moving from LCD to OLED and may help alleviate concerns for many people if they were only comparing basic luminance specs.
Brands like Asus, Gigabyte, MSI, Samsung Electronics and others who use QD-OLED panels could potentially feature this branding and the associated logos on their QD-OLED monitors to help raise awareness and position the capabilities more clearly.
One disclaimer is that Samsung Display say that “any marketing or promotional use of the TrueBright verification or logo by a set maker must clearly indicate that this verification applies only to the OLED panel itself, not to the assembled product incorporating such panels, as UL’s testing was performed on a standalone OLED panel, not as part of a set incorporating such panels.”

Summary and TL;DR
There’s a lot to take in here, but we’ll try and summarise here as best we can:
- The perceived brightness of an image to a user is influenced by not only the light output (the luminance) but also by the vividness of colours, and importantly by the contrast of the image.
- The basic rule is that perceived brightness will appear higher where contrast is higher.
- Because OLED panels can produce a true black, they have a much higher contrast than conventional LCD panels.
- A method already exists for measuring the perceived brightness of a display. It’s called ‘Perceptual Contrast Length’ or ‘PCL’ and was defined by SEMI (Semiconductor Equipment and Materials International), who are a long-standing industry association.
- According to PCL calculations, at the same luminance an OLED is perceived brighter than a conventional LCD due to deeper true black and a higher contrast.
- The panel manufacturer Samsung Display have introduce a certification scheme called “TrueBright”, designed to help consumers more accurately understand the perceived brightness of different displays and the benefits that increased contrast can bring.
- Their claims for TrueBright have been independently tested and verified by global safety science company UL Solutions, who have issued a “Marketing Claim Verification” for this approach using PCL calculations.
- UL Solutions independently tested and validated a range of different OLED panels against conventional LCD’s and found that OLED’s looked between 25 – 188% brighter than conventional LCD’s which were configured at the same luminance level. On average from all their tests they said the OLED’s appeared 50% brighter.
- PCL scores can also be used to calculate the equivalent luminance of an LCD panel that offers the same perceived brightness as an OLED. If you’re moving from an LCD to an OLED this could be useful for comparing their actual perceived brightness, rather than relying only on simple luminance measurements.
- Based on the defined testing methodology PCL calculates (for example) that a 250-nit OLED has the same perceived brightness as a 443-nit LCD. Similarly a 300-nit OLED has the same perceived brightness as a 510-nit LCD. This demonstrates just how much brighter an OLED can look than its luminance spec suggests, thanks to its vastly superior contrast ratio.
- A wide range of example data is provided in this article for different luminance OLED panels, showing their equivalent LCD luminance to reach the same perceived brightness.
- TrueBright certification tiers and logos have been created to help articulate the perceived brightness benefits. In the above example, the 250 nit OLED would be certified as TrueBright 400 and the 300 nit OLED would be certified as TrueBright 500.
- TrueBright certification and testing assumes a “conventional LCD” with a contrast ratio of 1500:1, a good mid-ground and a proxy for various LCD technologies. If comparing against a lower contrast ratio LCD like an IPS or TN Film panel, the benefit would be even greater. If comparing against a higher contrast LCD like a VA panel, the benefit would be less.
- Testing methodology only considers what we would call the “maximum contrast scenario”, using white and black test patterns in a dark room, as is the standard for luminance and black depth measurements today, and various other industry measurement approaches.
- In real-world content where contrast will vary all the time, and where different colours, shades and tones apply, the differences and benefits will vary. The higher contrast situations will show the greatest perceived brightness benefit on an OLED compared with an LCD of equivalent luminance.
- HDR comparisons are far more complicated than SDR due to additional factors including local dimming capabilities, colour gamut, ABL behaviour and so on. SDR is a far simpler comparison.
- Other factors such as panel technology, coating and ambient lighting can have an impact on real-world contrast too.
Our thoughts and summary
The TrueBright standard is a good approach we think to try and articulate the brightness variation between different display technologies, instead of simply relying on the long-standing luminance specs that have existed forever. In today’s world of newer display technologies, using luminance alone is incomplete at best, or misleading at worst. We’ve always had contrast ratio figures as well which have been a useful additional spec in the past, but are pretty irrelevant now with true black levels achieved on modern panel technologies like OLED, creating a basically infinite contrast ratio. It’s good to see a new approach to try and provide a simple way to articulate a complicated topic.
The approach of PCL seems solid for helping to measure and define perceived brightness, it’s existed for a long time and independent testing and validation from UL Solutions brings further reassurance around its validity. Real-life demonstrations and testing also support the calculations made using PCL well.
When comparing the brightness between different displays and considering the move from LCD to OLED you shouldn’t refer to luminance specs alone, it won’t tell you what you need to know. Understanding the TrueBright tier relevant for the OLED panel you’re considering will be more useful, telling you approximately, and in 100 nit increments, what the equivalent LCD luminance would be for the same perceived brightness. You need to be mindful that in real-world usage the brightness benefits will vary, but even so it seems like a more relevant spec to consider than luminance alone.
Introducing something like TrueBright is probably long overdue, and seems to be a good way to take things beyond a basic luminance figure, and in to something hopefully more relevant to consumers who are considering the shift from conventional LCD panels to new OLED panels. We’d like to see display manufacturers adopt the certification as well in an effort to help articulate the brightness of OLED monitors more clearly too, and help spread the word on the whole topic.
Please keep in mind that what we’re not saying here is that OLED’s will be bright enough for everyone. There’s plenty of people who find them too dark still for their usage and who want something brighter. We’d of course like to see further improvements to both SDR and HDR brightness on OLED monitors, but there’s at least been some positive signs with panel improvements this year which is good to see. What we are saying is that you should not rely on luminance specs alone, and don’t fall in to the trap of thinking “hey my LCD is rated as 350 nits, a 250 nits OLED is going to be too dark for me”. Hopefully this article has helped explain why it’s a lot more complicated than that. OLED screens will appear brighter in practice than their luminance-only specs suggest.
- As a side note, if you are finding OLED brightness too low for Windows desktop usage, a very common issue is the improper use of Windows HDR that you might want to read up on – we see this all the time!
Useful Guides

The Best OLED Gaming Monitors to Buy in 2026
The Best Recommended Gaming Monitors 2026
We may earn a commission if you purchase from our affiliate links in this article- TFTCentral is a participant in the Amazon Services LLC Associates Programme, an affiliate advertising programme designed to provide a means for sites to earn advertising fees by advertising and linking to Amazon.com, Amazon.co.uk, Amazon.de, Amazon.ca and other Amazon stores worldwide. We also participate in a similar scheme for Overclockers.co.uk, Newegg, Bestbuy , B&H and some manufacturers.
Stay Up To Date
 |  | |
| Subscribe on YouTube | Follow us on X | Support Us |