Display Measurement and Testing with the UPRtek MK550T Spectroradiometer
Introduction
At TFTCentral we strive to bring you a wide range of measurements and results from the monitors we review, and we are always looking for new ways to improve how we do that. We have recently been exploring a new device that will allow us to offer improved accuracy and reporting of several key monitor measurements and we are looking to incorporate this in to future review. The device is from the manufacturer UPRtek and is their MK550T spectroradiometer. This is also co-branded in the US under the Gamma-scientific brand as their GS-1160.
This device offers improved accuracy and capability for measuring things like colour gamut, black depth, contrast ratio and even flicker. It also comes in a handy portable form-factor with a built in display allowing for measurements and some testing away from our test lab, should the opportunity arise again in the future. We will explain in this article what the new device is, what benefits it will offer and also look at the software we will use to help improve our future reviews and results.

The Difference Between a Colorimeter, Spectrophotometer and a Spectroradiometer
We will try and keep this as simple as we can and focused largely on display measurement and calibration. Colorimeters are the most widely used devices of this type and are popular even at the consumer level (e.g. X-rite i1 Display Pro or Datacolor SpyderX are good examples). A typical colorimeter device is based on an “imitation” of the human eye’s perception of colour. A colorimeter is a tri-stimulus color measurement tool that provides an objective evaluation of color characteristics based on light passing through the primary filters of red, green, and blue (RGB). It simulates how the human eye perceives color. These devices are compact in size, fast, lower cost and simpler to use. However, this method can be a bit too rough to produce super-accurate measurements. In addition the production of such filters is extremely difficult and the manufacturing tolerance of each filter type of a colorimeter is unstable, requiring frequent calibration to ensure accuracy. Colorimeters from a display measurement and calibration point of view are also often designed to work with a specific backlight type and may show error in their measurements when used with different displays and backlights. For instance measurements of the white point/colour temperature are often prone to error by as much as 500k from some devices, when used with unexpected backlight types. Correction matrices and modern devices/software are better at this though, for example we saw far more reliable measurements from the SpyderX colorimeter when we tested it last year. Colorimeters typically offer better black depth measurement than some of the spectro devices discussed below, which can be useful for measurement of modern displays and for calculating contrast ratio.
The distinctions between spectrophotometer and spectroradiometer devices are complicated, also not helped by the common abbreviation of one or the other to “spectrometer” in many places. By definition a spectrophotometer measures spectral reflectance of an illuminated object while a spectroradiometer measures spectral radiance of an emissive source. In our past testing we have made use of the i1 Pro series over the years (e.g. the latest X-rite i1 Pro 3 family), and X-rite classify these as “spectrophotometers”, although technically the device is both depending on its usage. In fact when measuring a display which is emissive, you would say it is performing as a spectroradiometer in function. To avoid getting in to confusing areas, we will refer to these devices under the same category or “spectros” for now. If you want to delve in to more technical information then there is some detail on Konica Minolta’s website here as a start, or on Wikipedia.
The optical spectrum can be detected by a spectro and is a more complex color measuring instrument that factors in light intensity as a function of the color. It performs full-spectrum color measurement, as opposed to a colorimeter’s tri-stimulus procedure, and generates color data that’s beyond observation by the human eye. These are often larger in size and more expensive , but offer greater functionality and precision for full-spectrum measurement. These devices us ‘diffraction grating’ that decomposes the mixture lights into different wavelengths. Then, the sensory array can measure and obtain each light intensity from various wavelengths allowing for the spectrum to be produced.

Some of the additional accuracy difference comes down of course to the target market and uses for these kind of devices, not to mention the cost. A typical colorimeter like the popular X-rite i1 Display Pro or SpyderX for instance are consumer oriented devices, retailing for a few hundred dollars at most. These are decent devices for a typical consumer who wants to calibrate their display and have some control over the settings, and produce decent results. They also have easy to use and intuitive software. They will of course not offer the absolute levels of accuracy that a pro-grade device like a spectro device might offer. A device like the UPRtek MK550T we are looking at here is aimed more at lab usage, manufacturers and production lines and costs a lot more as a result. We are interested in the device for the purposes of increasing the accuracy of our measurements and testing, and to provide some capabilities that go beyond our current measurement options.
Key Features

UPRtek have sent us their MK550T hand-held device which offers a range of features and options for testing of displays, and can offer some great benefits for our monitor reviews and results. This includes:
- Lightweight and small battery powered portable device – this means we can in theory take it to press and exhibition events and away from our testing lab, and take some measurements of displays “in the wild” if the opportunity arises. If press events ever start up again after lockdown, and we get chance to see new screens early then this could in theory allow us to take some measurements and provide some analysis before we get access to the screen for full testing. We would be able to test colour gamut coverage, brightness range, black depth, contrast ratio, white point and flicker for instance using the device. It has a battery life of around 5 hours fully charged. It also has an SD card slot as well so that results and data can be saved to the device, and it can be used standalone without needing to be connected to a PC and their various software packages all the time. It also has a built in 3.5″ touch screen so you can select settings, navigate different tests and carry out all the measurements right from the built-in screen. No need to have separate software running to take your measurements.
- It works on a wide range of display and backlight types – without needing to worry about colour filters etc. This is great given the wide range of backlight technologies commonly used in the display market and that we are now testing including KSF LED, W-LED, CCFL, Quantum Dot, OLED etc. Our X-rite i1 Pro 2 spectrophotometer also works very well with a wide range of backlight types, whereas some lower cost colorimeter devices are only really designed to work with a specific type, and require correction matrices within the software to accommodate non-standard backlights. This new device ensures great flexibility for different display and backlight types.
- Measurements are fast and simple – assuming you have a sensible testing environment and setup, you really just point it at the screen and press a button on the side of the device. The measurements are quick and easy.
- It has a low black depth limit, better than our current devices even – The black depth limit of the MK550T is an impressive 0.001 cd/m2. This is considerably lower than our X-rite i1 Display Pro Plus colorimeter device which can reach 0.02 cd/m2 minimum. This will be very helpful when we are testing HDR displays with local dimming, where the black point can often reach less than the current 0.02 cd/m2 limit. The same goes for even some VA technology panels at very low brightness settings, where the black depth often goes below our measurement limit. A lower black point allows us to more accurately measure these displays and provide contrast ratio measurements.
- Colour gamut can be more accurately calculated – we have recently written an article looking at colour gamut in more detail and how this device can help improve our measurements and results. It allows us to more accurately measure the x,y and u’,v’ coordinates for RGB and plot these using a special calculation tool to work out the exact coverage of popular colour spaces like sRGB, DCI-P3 and Adobe RGB, in both CIE-1931 and CIE-1976. It can also allow us to calculate “relative” coverage if the colour gamut stretches beyond the given reference space. See our Explaining Monitor Colour Gamut and Improving Measurement Accuracy article for more information.
- Flicker testing can be completed – we can do this today with our oscilloscope anyway, but the MK550T can also quickly and easily test display flicker either from the built in display (standalone, again useful away from a testing PC) or via the provided uFlicker software (discussed below).
- Two useful pieces of software are provided – UPRtek provide their own uSpectrum and uFlicker software which are discussed in more detail below. As we said earlier, the device can also be used standalone for many tests and measurements, although interpreting some of the results (like plotting colour gamut coverage) requires an additional separate tool via a PC.
Specifications
We have provided the full spec sheet of the MK550T below, but we will call out a few key specs from the product pages of note. The UPRtek MK550T Handheld Spectrometer optical design is based on Spectral Sensor which provides users with high efficiency and high precision measuring performance.

Key measuring parameters:
- Luminance Measuring Range: 0.001 ~ 5,000 cd/m2. This is the total possible range although we should note that the accuracy drops a little below 0.05 cd/m2 down to around +/-8% but this is still good. The brighter the luminance the higher the level of accuracy. For example the Luminance Accuracy is +/- 3% when measuring between 0.2 and 100 cd/m2
- Color (x/y) : Accuracy +/- 0.003 @ 0.2 ~ 100 cd/m2
- Spectrum : Visible spectral data / graphic
- Color measurement in Chromaticity, x/y/u’/v’, XYZ, x10, y10, u10, v10
- Full Spectral data @ 380 ~ 780nm wavelength range
- Fast mode measurement, 100us to 5000ms for requirement of production
- Auto Dark for better S/N Ratio


uSpectrum Software

We still need to do some further experimenting with all the features in the software, but some initial tests are possible for our display testing. The software is split in to several sections down the left hand side. Perhaps most useful for our display testing is the “View” section. Here you can use the capture button at the top to take measurements of a given screen output. In this example we have taken 3 measurements of a red, green and blue colour block representing true RGB values. You can see the 3 measurements listed in the data section at the bottom where we have handily tagged them with the appropriate colour and there is a load of different data points captured from just a single quick measurement.
To the right for each one you can see the x,y coordinates (useful for CIE-1931 gamut calculation) and the u’,v’ coordinates (useful for CIE-1976 gamut). These are displayed for each measurement as you select it in the data section. By knowing these coordinates captured for the RGB primaries, and knowing that the device provides a high level of accuracy, we can use these to calculate the colour gamut of the display. We talked more about colour gamut coverage and calculations in our recent article if you’ve not yet read that.
The software does not contain a gamut calculation function itself, but we can use a special custom-made calculation tool to work out absolute and relative coverage for key colour spaces like sRGB, DCI-P3 and Adobe RGB. Or indeed any colour space if we needed to.
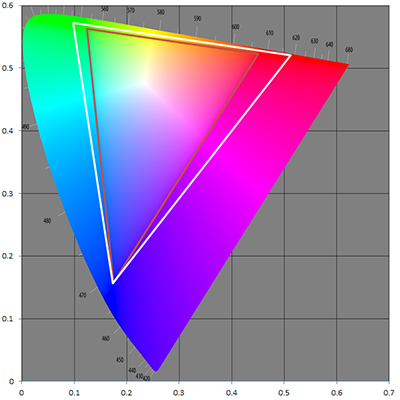
This allows us to produce CIE diagrams such as the above (based on the coordinates we just measured above). This shows the monitors colour gamut in the CIE-1976 diagram as the white triangle, relative to sRGB as the maroon/red triangle. We can also plot the other colour space references on this if we prefer. We will be able to feature these in our forthcoming reviews for more accurate gamut representation, relative to the more accurate CIE-1976 space as well. This tool also calculates the gamut coverage, in this case producing a 100% sRGB absolute coverage (129.9% relative coverage), 94.8% Adobe RGB (absolute) and 98.1% DCI-P3 (absolute). We will provide more detailed gamut measurements and explanations in our future reviews, but the UPRtek device, uSpectrum software and our custom calculation tool allows this to be produced with a high level of accuracy previously not possible.

You can change the measurements presented in that bottom right hand section as well if you want via the settings option, choosing from a wide range of measurement points. All are captured in the main data anyway, but that bottom section shows quick access to the key ones. We have it set up to show the colour temperature (CCT) and then the x/y and u’/v’ coordinates. You can also show useful things like luminance here.

Another possibility here is that we can hone in on specific colour spectrum, such as that produced for blue above. Useful for measuring things like low blue light modes.

You can even use the “show peak” slider at the top which then confirms where the peak is, in this case the blue peak is at the 451 nm wavelength which is common for many displays. Although some manufacturer specifically focus on shifting this blue peak further to the right where it is supposed to then be less harmful to the eyes. This section will allow us to more easily verify the wavelength of the blue peak if we need to.
Data can also be saved and exported in image format, as a CSV file or as a PDF report if needed. It can also be imported to the software from saved data including when capturing data with the device as a standalone unit separate to the software.
uFlicker Software

The uFlicker software allows you to check the flicker of a light source. Again you just point the device at the screen and press the ‘start’ button at the bottom, which carries out a continuous measurement and plots the frequency at the top left. In this instance it is measuring a screen with a direct current backlight and no PWM, and so you get a basically flat line. The scale of the graph makes this look a bit more noisy but this would be considered a flicker free screen.

If we change the Y axis scale via the settings menu to show from 0 (off) then you can see this as a flat line better. The ‘percentage’ figure on the right confirms a 1.69% flicker, so basically nothing. Next time we are testing a screen with a strobing blur reduction backlight, or if we find one with PWM backlight dimming we will update this section with some comparative screenshots showing that.

You can also use the flicker testing feature standalone from just the device, and then save the data to the SD card slot (standalone usage discussed below in more detail). Here is an image saved when testing the BFI mode on the LG CX OLED TV, with the TV set at 60Hz refresh rate but with BFI set to high. You can see here that the % flicker is now 99.96% (showing that it is flickering!) and the frequency of that flicker is 60Hz, something we’d also confirmed when we tested this TV before.
Standalone Device Usage
When used as a standalone device you still have access to a lot of the data from the small built in 3.5″ touch-screen.


The main menu presents a range of different sections you can enter. The basic section shown on the right captures key information for the light source you point it at. So again we could in theory measure pure RGB values if we want, or in this case we pointed it at the white background of a word document on the screen we are writing this article up on. We can capture information quickly like the luminance (Lv), the u’/v’ coordinates for CIE-1976 gamut plotting and the white point/colour temp (CCT). As we said earlier, this could be useful for some basic testing of displays away from our lab, being capable of measuring different preset modes and settings in some cases where it might be useful or interesting.


The “Spectrum” section shows the colour spectrum for the measurement you’ve taken as well (a white screen in this example). You can see the wavelength distribution here as well. We should note that all the sections allow you to save the results to an SD card, so you can then later analyse them independently, or via the uSpectrum software where you can import the readings easily. The CIE-1976 section is shown on the right where the u’ and v’ coordinates are plotted on the diagram. This section does not do any gamut coverage calculations or anything like that, we need to take the data from here when measuring RGB values and plot those separately.


The same thing can be done in the CIE-1931 section where the x and y values are measured and can be saved. The flicker section can also be used to measure any flickering from a light source. This could be useful to identify screens where PWM might still be used, or to measure things like the frequency of blur reduction backlights and so on.
Further Information and Reading
For further information about UPRtek’s devices including the MK550T you can contact them at s[email protected]. If you are in the US you can also contact their partner Gamma-scientific at [email protected]
You may wish to read our recent Explaining Monitor Colour Gamut and Improving Measurement Accuracy article for details about how we will use the new device for gamut calculations and why. For lots more detailed discussion about colour spaces please also see our Pointer’s Gamut article.
 | If you appreciate the article and enjoy reading and like our work, we would welcome a donation to the site to help us continue to make quality and detailed reviews and articles for you. |