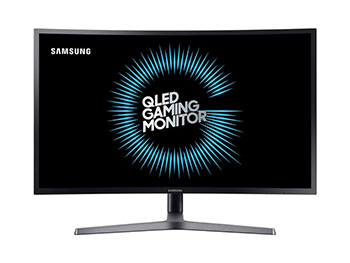
Introduction
Samsung have not focused on the gaming
monitor market for a while, but they are now back, having recently released their interesting CHG70
range. The line-up boasts an impressive list of modern specs and features and
their aim is to offer something high end for gamers, with a whole host of
features that help to meet their demands. The range offers a QHD 2560 x 1440
resolution which helps provide more detail than older 1920 x 1080 models, and
certainly a welcome upgrade considering the size of one of the models, the 31.5"
C32HG70. The new screens also support AMD FreeSync 2 which offers the familiar
dynamic refresh rate benefits along with HDR gaming support. They have a native 144Hz refresh rate VA
technology panel with a 1ms
MPRT (Motion Picture Response Time) spec and a whole host of additional settings
and extras for gaming needs. They also offer an extended colour space thanks to Quantum
Dot technology, with Samsung using their "QLED" branding from the TV sector on
this monitor range to signify this.
The C32HG70 is the largest of the current
CHG70 models at 31.5" in size, but most of the spec and features remains
identical from the 27" version as well. This 31.5" model has an integrated power supply and that
appears to be the only real difference. It is the C32HG70 model that we have
with us now for testing.
Before we get started we should mention the
firmware on this screen. Samsung have made it possible for the user to quickly
and easily update the firmware of the CHG70 models via a simple website download
and a USB stick. This allows them to release small updates or bug fixes during
the life of the monitor which is handy, as it's always a pain to need to return
your screen to the manufacturer for this kind of thing should an issue arise.
The US Samsung
website has the latest firmware available for download along with
instructions of how to do it (also covered in the user manual). We first of all
updated to the latest firmware at the time of testing (v1013.0). It seems there
have been quite a few firmware versions since original release as ours was actually
originally on v1005.0). We know that the latest firmware extends the FreeSync range
and makes some other minor undisclosed adjustments to improve performance.
If you appreciate the review and enjoy reading and like our work, we would welcome a
donation
to the site to help us continue to make quality and detailed reviews for you.
|
Check Pricing and Buy - Direct Links
|
|
Amazon
|
|
TFTCentral is a participant
in the Amazon Services LLC Associates Programme, an affiliate
advertising programme designed to provide a means for sites to earn
advertising fees by advertising and linking to Amazon.com, Amazon.co.uk,
Amazon.de, Amazon.ca and other Amazon stores worldwide. We also
participate in a similar scheme for Overclockers.co.uk. |
Specifications and Features
The following table gives detailed information
about the specs of the screen as advertised:
|
Monitor
Specifications |
|
Size |
31.5"WS
with 1800R curve |
Panel Coating |
Light AG coating |
|
Aspect Ratio |
16:9 |
Interfaces |
1x DisplayPort
1.4, 2x HDMI 2.0b
|
|
Resolution |
2560 x 1440 |
|
Pixel Pitch |
0.272 mm, 93.24 PPI |
Design
colour |
Matt black bezel, enclosure
and stand with dark grey base |
|
Response Time |
1ms MPRT |
Ergonomics |
Tilt, 145mm height, swivel, rotate |
|
Static Contrast Ratio |
2400:1 (min) 3000:1 (typ) |
|
Dynamic Contrast Ratio |
'Mega' |
VESA Compatible |
Yes 100mm (using provided bracket) |
|
Brightness |
350 cd/m2
600 cd/m2 peak with HDR |
Accessories |
Power cable, DisplayPort,
HDMI and USB cables |
|
Viewing Angles |
178 / 178 |
|
Panel Technology |
Samsung SVA |
Weight |
with stand: 9.6 Kg |
|
Backlight Technology |
W-LED |
Physical Dimensions |
(WxHxD)
724.2 x 621.8 x 380.5 mm |
|
Colour Depth |
1.07b (8-bit+FRC) |
|
Refresh Rate |
144Hz maximum
FreeSync supported at various ranges (see later in review) |
Special
Features |
2x
USB 3.0 ports (1 with fast charging), headphone out, mic in/out, factory
calibration with report, FreeSync 2, HDR support |
|
Colour Gamut |
Moderately beyond standard
gamut with Quantum Dot
125% sRGB, 95% DCI-P3 |
The C32HG70 offers a decent range of
modern connectivity
options with 1x DisplayPort 1.4 and 2x HDMI 2.0b
connections offered. The
digital interfaces are HDCP certified for encrypted content and the video cables
are provided in the box for DisplayPort and HDMI which is handy. These are the
latest interface versions which allow HDR support from external devices over
HDMI, and from a PC via HDMI or DisplayPort.
The screen has an internal power supply and comes
packaged with the power cable you need (note that the 27" C27HG70 has an
external power supply). There are also 2x USB 3.0 ports located on the back of
the screen with the video connections, one offering fast charging support. A
headphone-out, mic in and mic out connection are also provided
if you need them.
Below is a summary of the features and connections
of the screen:
|
Feature |
Yes / No |
Feature |
Yes / No |
|
Tilt adjust |
 |
DVI |
 |
|
Height adjust |
|
HDMI |
|
|
Swivel adjust |
|
D-sub |
|
|
Rotate adjust |
|
DisplayPort |
|
|
VESA compliant |
|
Component |
|
|
USB 2.0 Ports |
|
Audio connection |
|
|
USB 3.0 Ports |
|
HDCP Support |
|
|
Card Reader |
|
MHL Support |
|
|
Ambient Light Sensor |
|
Integrated Speakers |
|
|
Human Motion Sensor |
|
PiP / PbP |
|
|
Touch Screen |
|
Blur Reduction Mode |
|
|
Factory calibration |
|
G-Sync |
|
|
Hardware calibration |
|
FreeSync |
|
|
Uniformity correction |
|
Wireless charging |
|
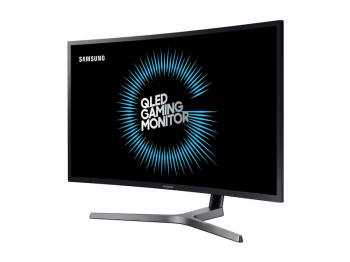
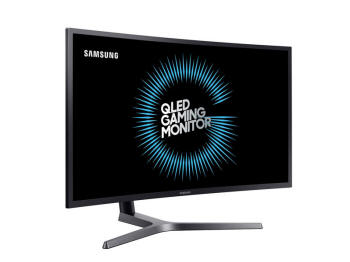
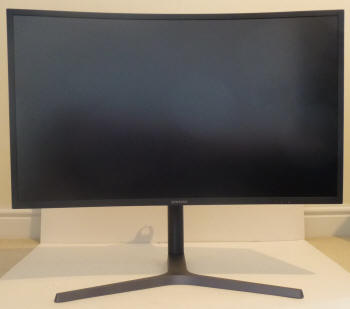
Design and Ergonomics
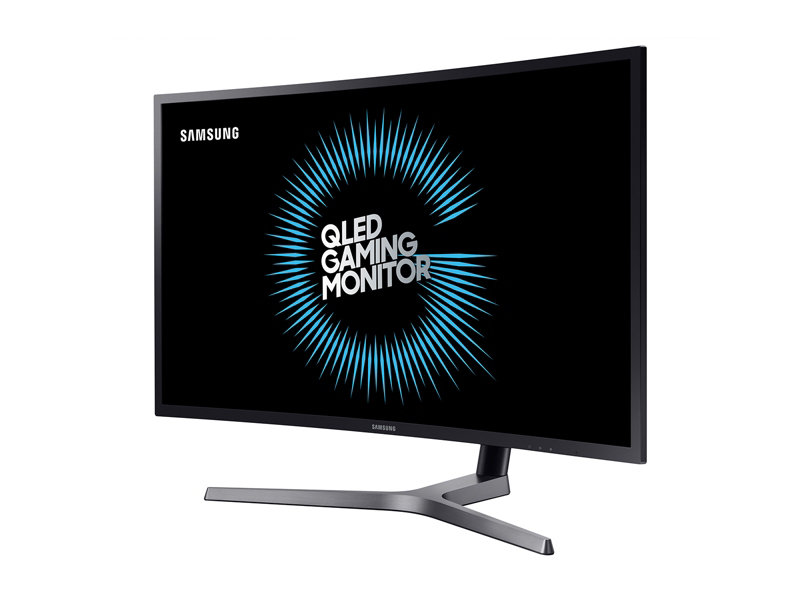
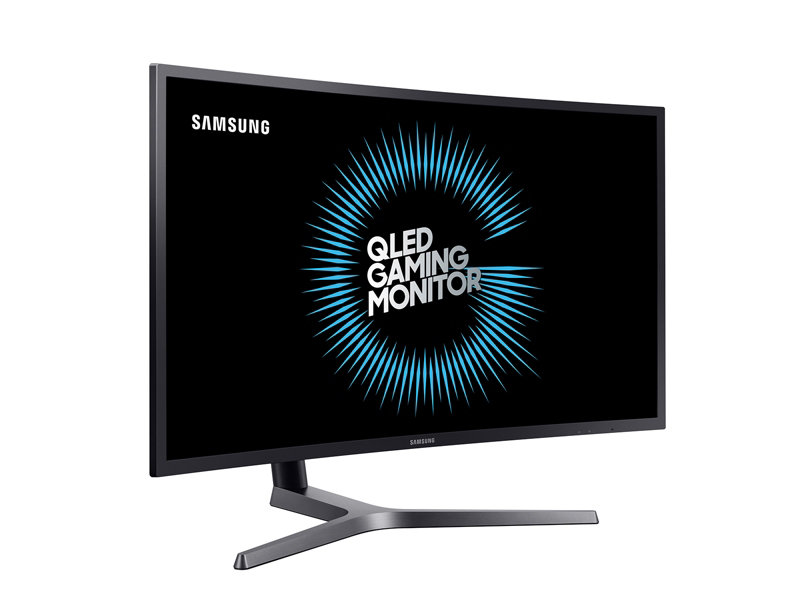
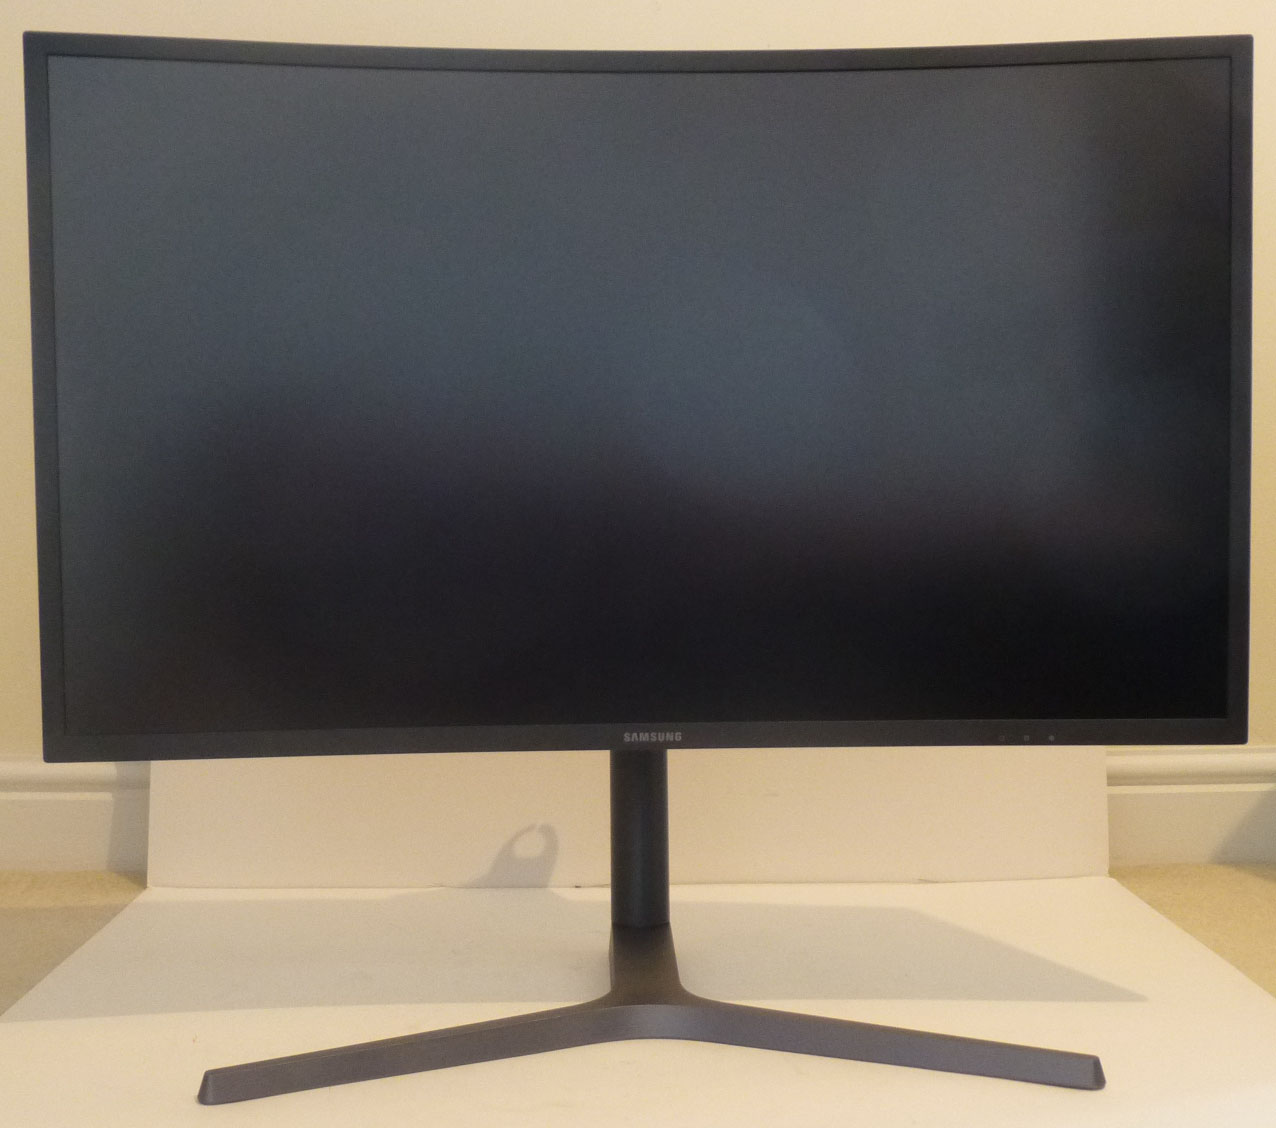
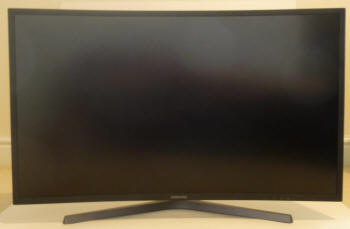
Above: front views of the screen. Click for larger versions
The C32HG70 comes in a mostly black design,
with matte plastics used for the bezel and rear of the screen. The bezel
around the panel is thin at 12mm around the top and sides, and a slightly
thicker 16mm along the bottom edge. There is a matte medium-grey Samsung
logo in the middle of the bottom bezel, but no other markings or writing
anywhere else. Around the side edges of the screen edge is a dark brushed aluminium
style plastic trim which looks nice. This matches the dark silver
plastic finish of the foot of the stand, although that isn't an aluminium
appearance on the foot.
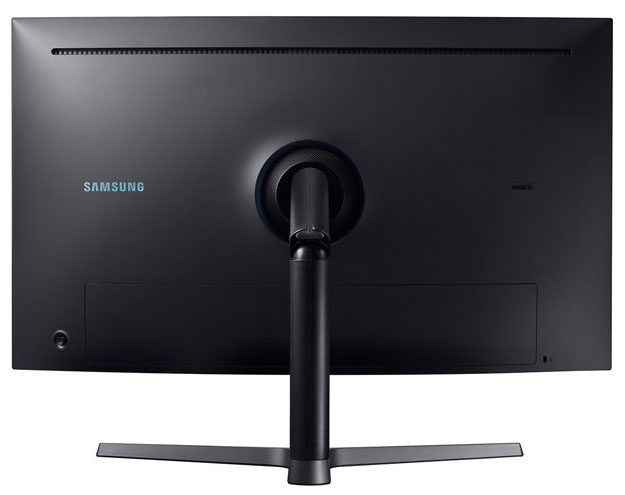
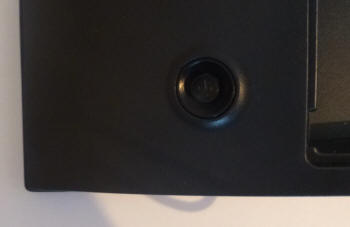
Above: rear view of the screen
The back of the screen is enclosed in a matte
black plastic with a rounded and smooth finish. There is a shiny silver
Samsung logo on the left hand side, and you will also see the OSD control
joystick in the bottom left hand area. The video connections are hidden
behind a removable plastic section at the bottom in the photo above. The
stand attaches in to the middle of the back of the screen as shown.
The arm for the stand comes pre-attached in the retail box, and you just
have to screw the foot on to the bottom which is easy. You are able to remove the stand
if you want and can use the provided metal bracket to create a VESA 100
attachment for wall- or arm-mounting. This might be useful to some users
since the screen has a very deep profile with the provided stand (380.5mm
depth). This means you need a deep desk to ensure you can push the
screen far enough back so that it's at a comfortable viewing position. We
found it too deep for our test bench which is only about 610mm deep.
The lighting system on this screen is
also hidden behind this circular stand attachment and glows around a small
area when you turn the feature on. If you want, you can also remove the
larger circular plastic section to reveal more of an area for the
lighting.
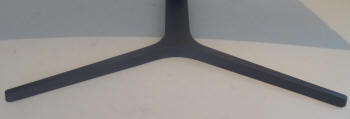
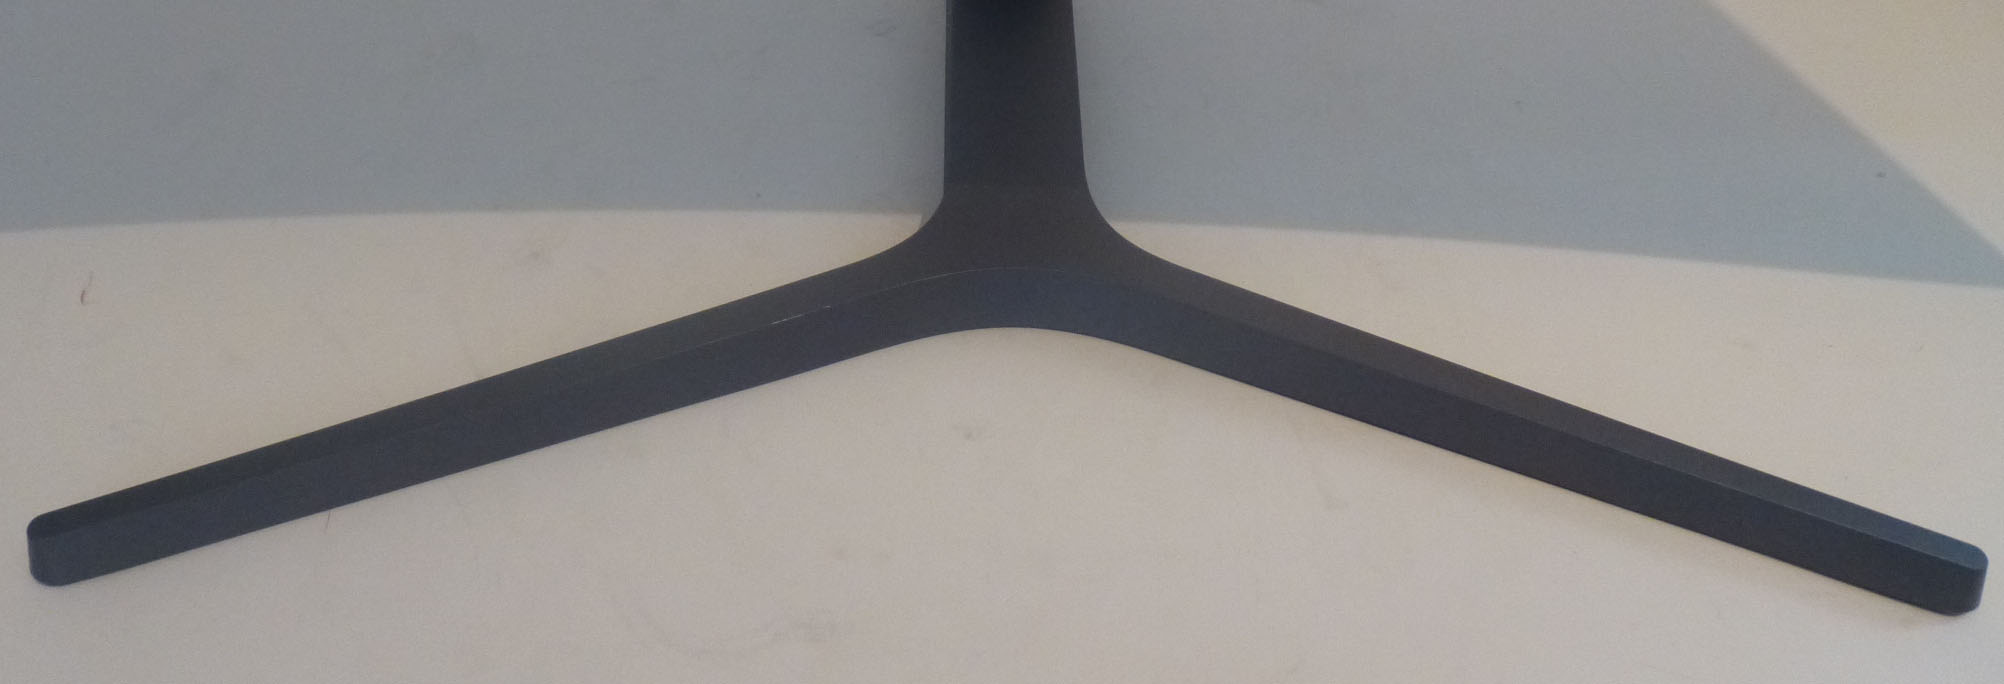
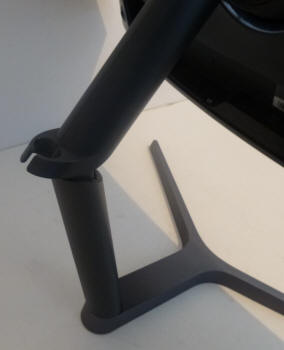
Above: view of the foot of the stand. Click for larger version
The foot of the stand is finished in a dark
silver coloured plastic and provides a wide and sturdy base for the large
screen.

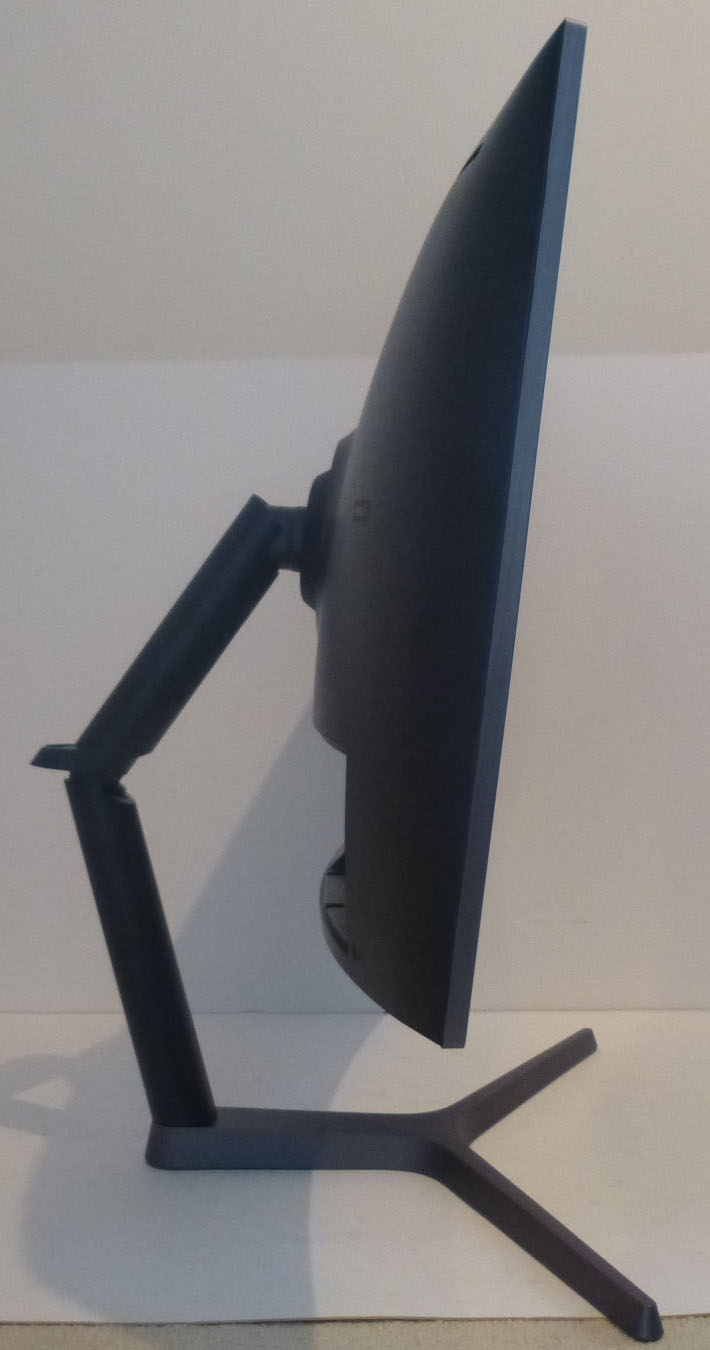
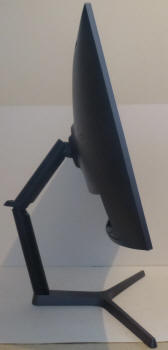
Above: side view and stand
The side profile of the screen is shown
above. The actual screen looks thicker than you might expect but that's
only because of the perspective of the photo and the curved nature of the
screen. You can see how deep the stand is here.
Above: rear of the stand showing the cable tidy. Click for larger version
There is a useful cable tidy clip in the back
of the stand as shown above.
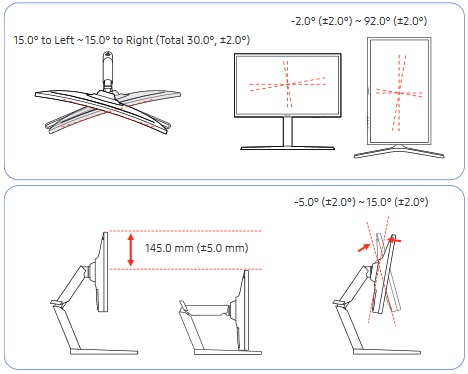

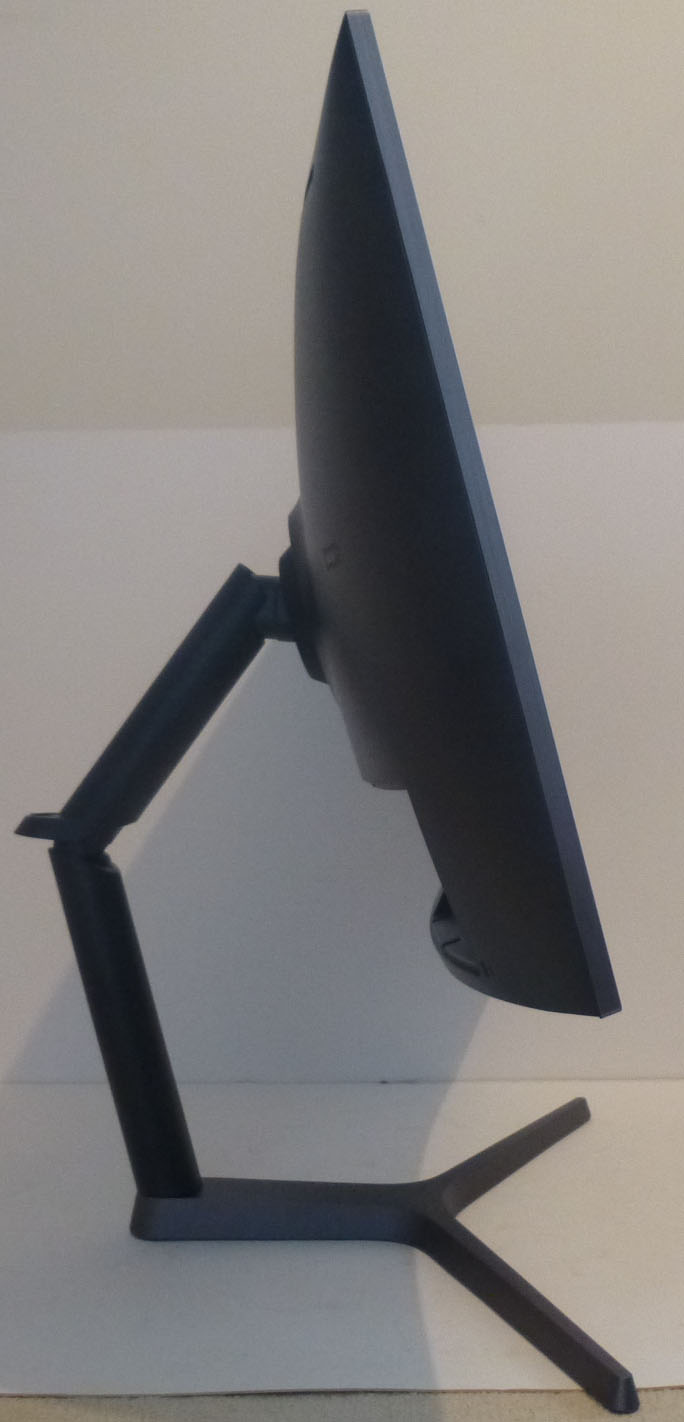
Above: full tilt range shown. Click for larger versions
There is a good set of ergonomic
adjustments offered from this screen. Tilt is smooth but stiff to operate,
and offers a reasonable range of adjustments as shown above.
Above: full height adjustment range shown. Click for larger versions
Height
adjustment is a little stiff too but offers smooth movements, with a
total adjustment range of 135mm measured. At the lowest setting the bottom edge of the
screen is ~50mm from the edge of the desk, and at maximum extension is is
~185mm.
Side to side swivel and rotation adjustments are
also provided and are easier to re-position than the tilt and height. Both also
offer smooth movement, although we'd question the usability of the rotation
function given the curved format of the screen. It's there if you want it
though. There is a bit of a wobble from the screen if you move it or knock it
during normal use because of the fairly small contact area of the stand on the
back. In every day use it remains stable enough on the desk though.
A summary of the ergonomic adjustments
are shown below:
|
Function |
Range |
Smoothness |
Ease of Use |
|
Tilt |
Yes |
Smooth |
Stiff |
|
Height |
135mm |
Smooth |
Quite stiff |
|
Swivel |
Yes |
Smooth |
Easy |
|
Rotate |
Yes |
Smooth |
Easy |
|
Overall |
Good set of adjustments.
Tilt and height could be easier to use. Some wobble from the stand |
The materials were of a good standard and the
build quality felt pretty good as well. There was no audible noise from the screen,
even when conducting specific tests which can often identify buzzing issues.
The whole screen remained cool even during prolonged use as well which
was pleasing.
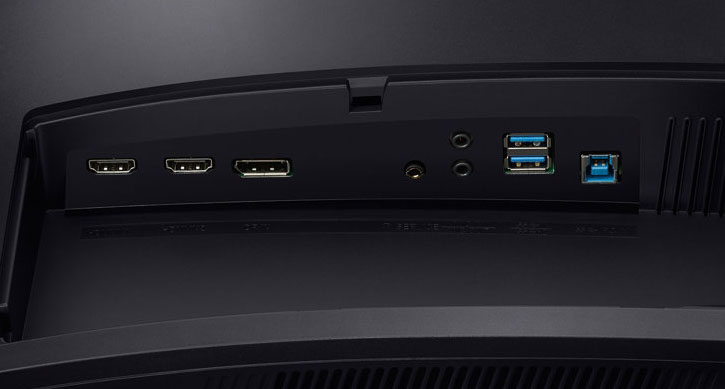
Above: connection options on the back of the screen
The back of the screen features the
connections. There are the 2x HDMI 2.0b, 1x DisplayPort 1.4, headphone jack, mic in/mic
out, 2x USB 3.0 (1 with fast charging) and USB upstream connections.
OSD Menu
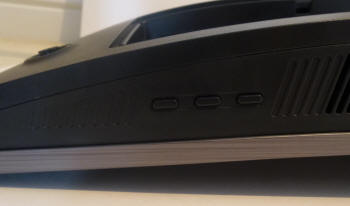
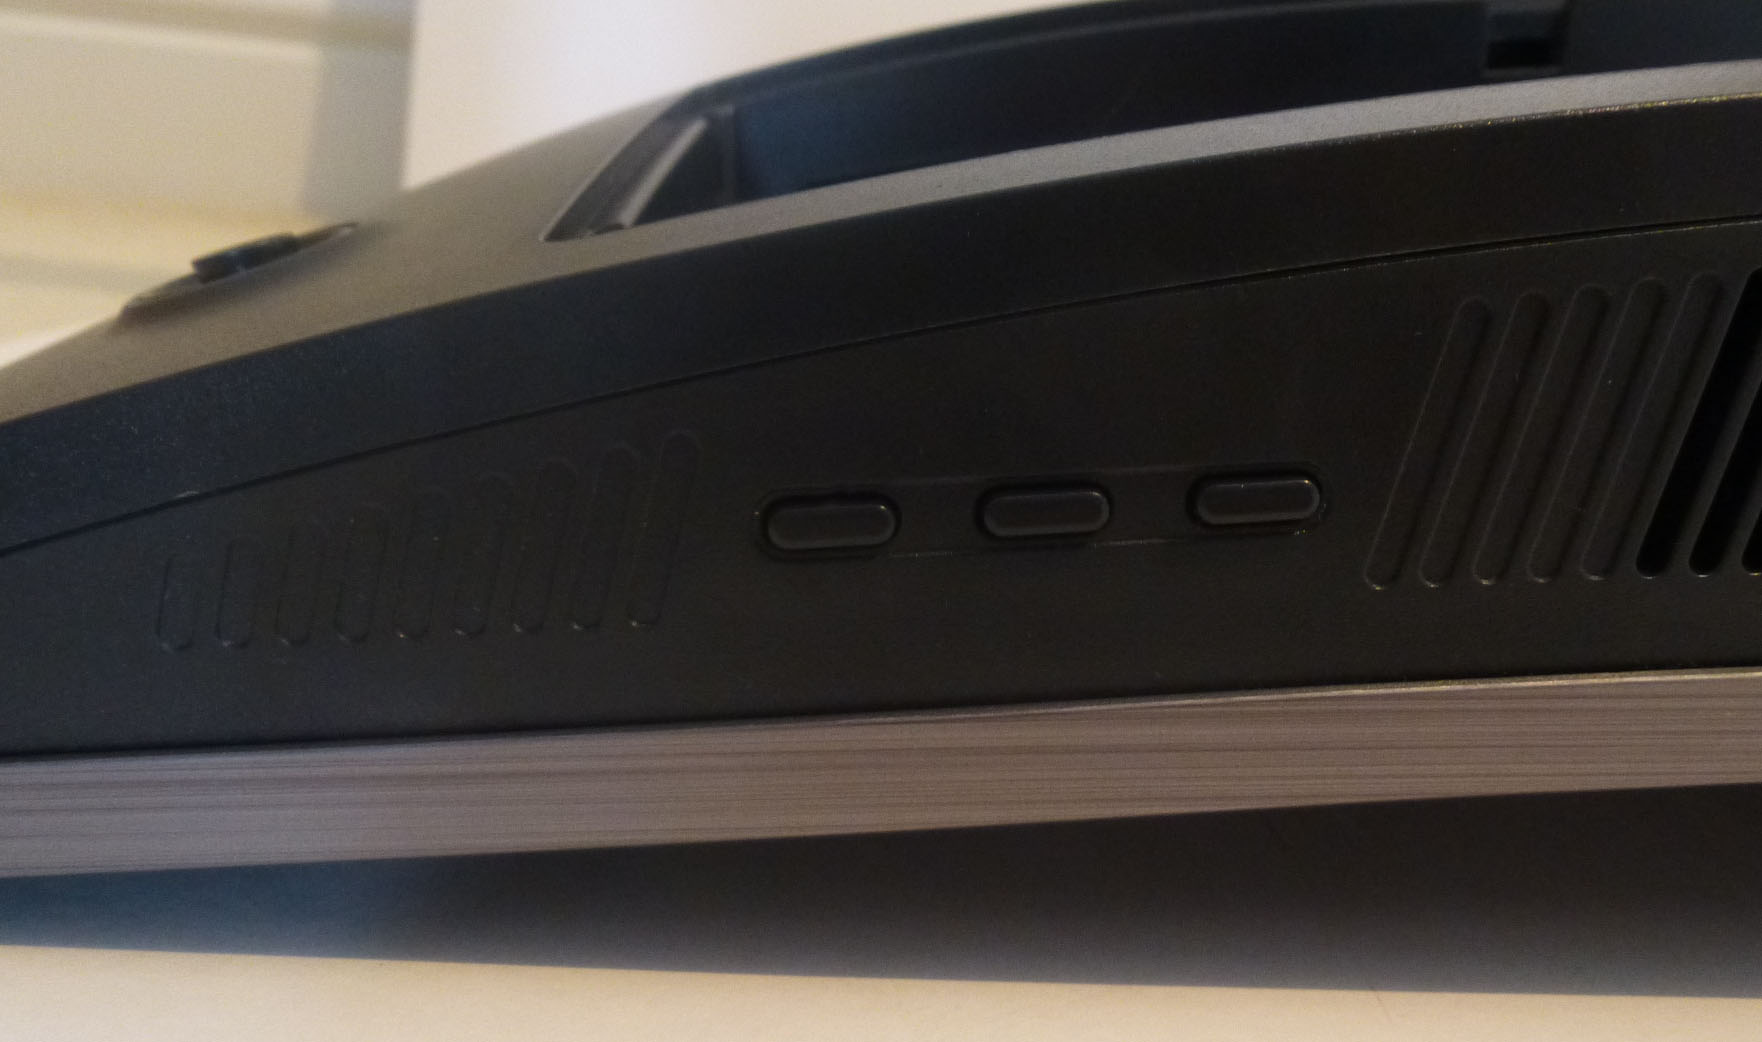
Above: OSD control joystick on the back right hand side of the screen (left)
and 3 buttons on bottom right hand edge (right). Click for larger
versions
The OSD menu is controlled through a single
joystick control located on the back of the screen on the right hand bottom
area (when viewing from the front). There are also 3 additional buttons to press
located on the bottom right hand edge of the screen.
The 3 pressable buttons on the bottom edge
control the 3 user customised gaming preset modes, allowing you to quickly and easily switch
between them. When you press them you are given a quick pop up confirming your
active options as shown above, which is a nice visual reminder of how you have
the screen set up. You can customise each of these gaming preset modes in the
main OSD menu.
Pressing up/down on the joystick gives you
quick access to the brightness/contrast/sharpness settings, while pressing
right/left gives you quick access to the volume control.
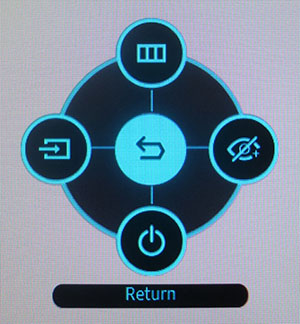
Pressing the joystick button in brings up a small menu allowing you
further quick access to the input selection (left) and Eye Saver mode (right). You
can then access the main menu from here (up).
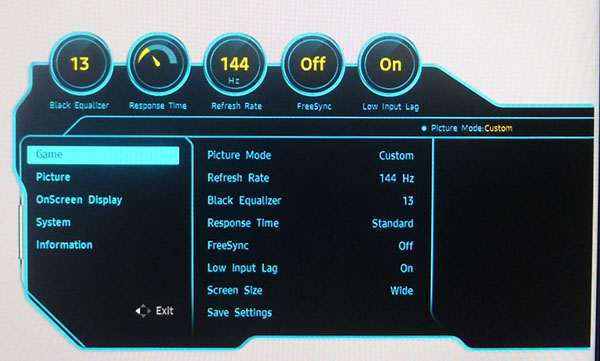
Going in to the main OSD menu brings up the
rather futuristic looking menu software above. This is split in to 5 sections
down the left hand side, with the options available in each section then shown
on the right in the middle. A help explanation is then provided on the right
hand side when you highlight any given option, explaining what it will do.
That's a nice touch we thought. Your current active gaming settings are
shown at the top as they were in the quick access to the gaming presets we saw
before.
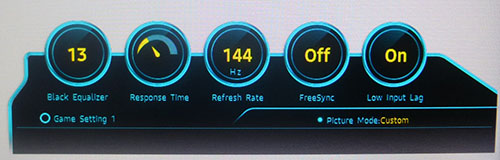
The 'game' section of the OSD menu has a whole host of
options including the active refresh rate, black equalizer, response time,
FreeSync, low input lag, aspect ratio control etc. Plenty to play with here, and
we will test most of these later on in the review.
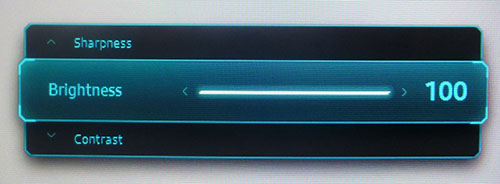
The picture section has various controls
useful for calibration as shown above. Going in to the 'color' menu gives you
settings for gamma, white point and the RGB channels as well.

The 'system' section has a few other useful
settings including the local dimming function for when you are viewing HDR
content.
The OSD menu was easy to navigate thanks to
the joystick, and it felt pretty intuitive and easy to use. There was a good
range of options to select from as well and the software was responsive and
looked quite different, in a nice way.
Power Consumption
In terms of power consumption the
manufacturer lists maximum usage of 78.0W, and <0.3W in standby. We carried out our normal tests to
establish its power consumption ourselves.
|
 |
|
State and Brightness
Setting |
Manufacturer Spec (W) |
Measured Power Usage
(W) |
|
Default (100%) |
- |
63.6 |
|
Calibrated (31%) |
- |
35.8 |
|
Maximum Brightness (100%) |
78.0 |
63.6 |
|
Minimum Brightness (0%) |
- |
24.3 |
|
Standby |
<0.3 |
0.6 |
|
Out of the
box the screen used 63.6W at the default 100% brightness setting. Once calibrated the screen reached
35.8W consumption, and in standby it
used only 0.6W. We have plotted these results below compared with other screens
we have tested. The consumption is comparable to most of the other larger 30 - 34" sized
screens we have tested as you might expect, with some of the smaller 25 - 27" screens
drawing slightly less power (comparing the calibrated states). Those with wide
gamut support like the Dell UP2718Q draw more power because
of their different backlight units, despite being a smaller size.
Panel and Backlighting
|
Panel Manufacturer |
Samsung |
Colour Palette |
1.07 billion |
|
Panel Technology |
SVA (VA-type) |
Colour Depth |
8-bit + FRC |
|
Panel Module |
LSM315DP01 |
Colour space |
Beyond standard
gamut with Quantum Dot |
|
Backlighting Type |
W-LED + Quantum Dot
(Samsung QLED) |
Colour space coverage (%) |
Quoted:
125% sRGB, 95% DCI-P3, 92% Adobe RGB |
Panel Part and Colour Depth
The Samsung C32HG70 features an
Samsung LSM315DP01 SVA (VA-type) technology panel which is capable of
producing 1.07 billion colours. This is achieved through an 8-bit colour depth
with additional Frame Rate Control (FRC) stage added.
Screen
Coating
The
screen coating is a light anti-glare (AG) like other modern VA panels we
have tested. Not semi-glossy like some older generation VA offerings, but nice
and light in line with modern IPS screens as well. It retains its anti-glare properties
to avoid too many unwanted reflections of a full glossy coating, but does not
produce an too grainy or dirty an image that some thicker AG coatings can.
There are no visible cross-hatching patterns evident.
Backlight Type and Colour Gamut
The screen uses a White-LED (W-LED) backlight unit
which is standard in today's market. This helps reduce power consumption
compared with older CCFL backlight units and brings about some environmental
benefits as well. This is paired with a Quantum Dot film coating which provides
an extended colour gamut beyond the typical 100% sRGB coverage of a W-LED backlight.
Samsung refer to the backlight as QLED in their marketing to distinguish this
use of Quantum Dot coating.
Quantum Dot is designed to help provide a
more bright and vivid image for more closer to real life colours. This helps
push the colour space of the screen up towards the now-popular DCI-P3 reference
that is used for HDR displays in the market. This gives rise to the quoted 125%
sRGB coverage, showing that it extends 25% beyond the typical 100% coverage a
common W-LED backlight monitor would offer. This equates to around 95% DCI-P3
coverage according to the Samsung specs, helping deliver a wider colour gamut
and also meet certain defined standards for HDR content. We will talk about that
HDR support later on in the review. Quantum Dot is also a more cost effective
and energy efficient way to extend the colour space of a monitor compared to
wide gamut LED backlights. It might not offer quite the same wide gamut (e.g.
the
Dell UP2718Q with GB-r-LED backlight offers 146% sRGB) but it is a half-way
house. It gives some boost to colours without adding a big cost to production
and retail, which is well suited to multimedia movies and games.
Anyone wanting to work with wider colour spaces would need to consider
wide gamut backlight screens. If you want to read more about colour spaces and gamut
then please have a read of our
detailed article.
Backlight
Dimming and Flicker
We tested the screen to establish the methods used
to control backlight dimming. Our in depth article talks in more details about a
previously very common method used for this which is called
Pulse Width Modulation (PWM). This in itself gives cause for concern to some
users who have experienced eye strain, headaches and other symptoms as a result
of the flickering backlight caused by this technology. We use a photosensor +
oscilloscope system to measure backlight dimming control
with a high level of accuracy and ease. These tests allow us to establish
1) Whether PWM is being used to control the
backlight
2) The frequency and other characteristics at which this operates, if it is used
3) Whether a flicker may be introduced or potentially noticeable at certain
settings
If PWM is used for backlight dimming, the higher
the frequency, the less likely you are to see artefacts and flicker. The duty
cycle (the time for which the backlight is on) is also important and the shorter
the duty cycle, the more potential there is that you may see flicker. The other
factor which can influence flicker is the amplitude of the PWM, measuring the
difference in brightness output between the 'on' and 'off' states. Please
remember that not every user would notice a flicker from a backlight using PWM,
but it is something to be wary of. It is also a hard thing to quantify as it is
very subjective when talking about whether a user may or may not experience the
side effects.
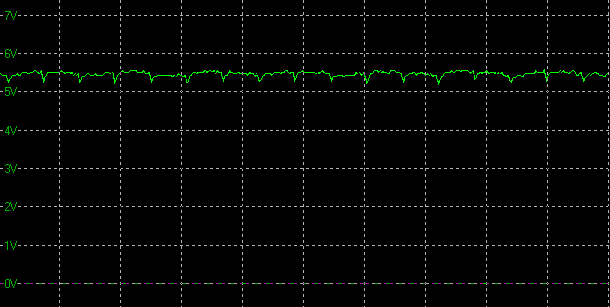
100%
70%
50%
0%

Above scale = 1
horizontal grid = 5ms
At 100% brightness there is a basically
constant voltage applied to the backlight as you might expect. Oddly, despite
the screen being advertised as flicker-free we were disappointed to see typical
PWM behaviour as you adjusted the brightness setting below 100%. By the time you
reach down to 70% brightness there is a full off/on modulation of the backlight.
This operated at a fairly low 340Hz frequency (regardless of your active refresh
rate). The duty cycle (on time) is reduced as you lower the brightness setting
down until you get to 20% brightness setting, and then at the lower end of the
range the modulation is also then reduced. That is, the 'on' voltage is reduced
to bring about a further reduction in perceived luminance. This use of PWM could
potentially cause issues with flicker and eye strain to those sensitive to it.
|
Pulse Width
Modulation Used |
Yes |
|
Cycling
Frequency |
340Hz |
|
Possible
Flicker at |
|
|
100% Brightness |
No |
|
50% Brightness |
Yes |
|
0% Brightness |
Yes |
Contrast
Stability and Brightness
We wanted to see how much variance there was in
the screens contrast as we adjusted the monitor setting for brightness.
In theory, brightness and contrast are two independent parameters, and good
contrast is a requirement regardless of the brightness adjustment.
Unfortunately, such is not always the case in practice. We recorded the
screens luminance and black depth at various OSD brightness settings, and
calculated the contrast ratio from there. Graphics card settings were left at
default with no ICC profile or calibration active. Tests were made using an
X-rite i1 Display Pro colorimeter. It should be noted that we used the
BasICColor calibration software here to record these, and so luminance at
default settings may vary a little from the LaCie Blue Eye Pro report.
|
OSD
Brightness |
Luminance
(cd/m2) |
Black
Point (cd/m2) |
Contrast
Ratio
( x:1) |
|
100 |
356.91 |
0.17 |
2099 |
|
90 |
323.95 |
0.15 |
2160 |
|
80 |
287.01 |
0.14 |
2050 |
|
70 |
251.28 |
0.12 |
2094 |
|
60 |
216.44 |
0.11 |
1968 |
|
50 |
180.59 |
0.09 |
2007 |
|
40 |
144.92 |
0.07 |
2070 |
|
30 |
108.68 |
0.05 |
2174 |
|
20 |
73.24 |
0.04 |
1831 |
|
10 |
36.03 |
0.02 |
1802 |
|
0 |
21.46 |
<0.02 |
- |
|
Total Luminance Adjustment Range
(cd/m2) |
335 |
Brightness OSD setting controls backlight? |
|
|
Total Black Point
Adjustment Range (cd/m2) |
0.15 |
|
Average Static Contrast Ratio |
2026:1 |
PWM Free? |
|
|
Recommended OSD setting
for 120 cd/m2 |
33 |
The brightness control gave us a good range
of adjustment. At the top end the maximum luminance reached 357
cd/m2
which nicely met the specified maximum brightness of 350 cd/m2
from the manufacturer. Note that the 600 cd/m2
spec you will see for peak luminance is only applicable when using the HDR
feature and local dimming, which we will talk about more
later on in the review.
The typical normal SDR (Standard Dynamic Range) use brightness met the spec nicely.
There was a very good
335 cd/m2 adjustment range in total, and so at the minimum setting
you could reach down to a low luminance of 21 cd/m2. This should be
adequate for those wanting to work in darkened room conditions with low ambient
light. A setting of 33 in the OSD menu should return you a
luminance of around 120 cd/m2 at default settings.
It should be noted
that the brightness regulation is controlled using
Pulse Width Modulation for all
brightness settings below 100% and so the screen may exhibit some
flicker or cause some eye-care issues to some users. That was a shame.
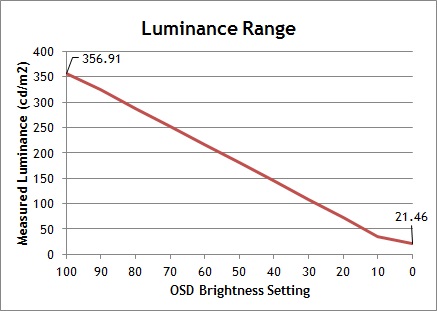
We have plotted the
luminance trend on the graph above. The screen behaves as it should in this
regard, with a reduction in the luminance output of the screen controlled by the
reduction in the OSD brightness setting. This is mostly a linear relationship as you
can see between 100 and 10% brightness. From 10 - 0% there is a more gradual
adjustment in the luminance output.
The average contrast ratio of the screen
was good at 2026:1 but this left it a little shy of the specified 2400:1 minimum
contrast ratio, and certainly less than the specified 3000:1 typical figure
which was disappointing. 2026:1 is still very strong of course thanks to the VA
panel, we had just hoped for slightly higher perhaps. We will see if
calibration
helps to improve this in a moment.
Testing
Methodology
An
important thing to consider for most users is how a screen will perform out of
the box and with some basic manual adjustments. Since most users won't have
access to hardware colorimeter tools, it is important to understand how the
screen is going to perform in terms of colour accuracy for the average user.
We restored our graphics card to default settings
and disabled any previously active ICC profiles and gamma corrections. The
screen was tested at default factory settings using our new
X-rite i1
Pro 2 Spectrophotometer combined with
LaCie's Blue Eye Pro software suite. An X-rite i1 Display Pro colorimeter was
also used to verify the black point and contrast ratio since the i1 Pro 2
spectrophotometer is less
reliable at the darker end.
Targets for these tests are as follows:
-
CIE Diagram - validates the colour space
covered by the monitors backlighting in a 2D view, with the black triangle representing the
displays gamut, and other reference colour spaces shown for comparison
-
Gamma - we aim for 2.2 which is the default
for computer monitors
-
Colour temperature / white point - we aim
for 6500k which is the temperature of daylight
-
Luminance - we aim for 120
cd/m2, which is
the recommended luminance for LCD monitors in normal lighting conditions
-
Black depth - we aim
for as low as possible to maximise shadow detail and to offer us the best
contrast ratio
-
Contrast ratio - we aim
for as high as possible. Any dynamic contrast ratio controls are turned off here
if present
-
dE average / maximum -
as low as possible.
If DeltaE >3, the color displayed is significantly different from the
theoretical one, meaning that the difference will be perceptible to the
viewer.
If DeltaE <2, LaCie considers the calibration a success; there remains a
slight difference, but it is barely undetectable.
If DeltaE < 1, the color fidelity is excellent.
Default Performance and
Setup
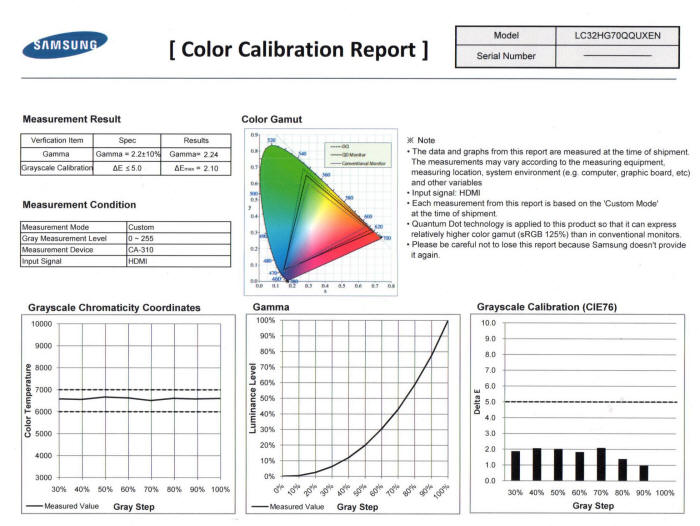
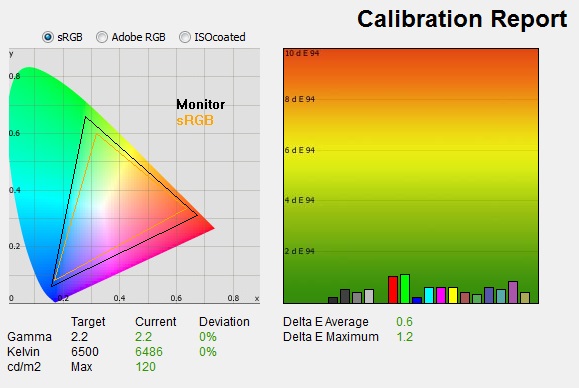
Above:
Factory calibration report. Click for larger version
The C32HG70, despite being a gaming screen,
comes with a factory calibration to try and ensure a reliable and accurate
setup for most users. The screen is factory calibrated in the default 'custom'
preset mode and comes with a specific calibration report for each individual
screen as shown in our example above. From this report we can tell that the
screen was factory calibrated to try and achieve a 6500k white point, 2.2
gamma and dE of less than 5.0.
Default settings of the screen were as follows:
Samsung
C32HG70
Default Settings


|
 |
|
Monitor OSD
Default Settings |
|
|
Picture Mode |
Custom |
|
Brightness |
100 |
|
Contrast |
75 |
|
Gamma |
Mode1 |
|
Color Tone |
Normal |
|
RGB |
50, 50, 50 |
|
Luminance
Measurements |
|
|
luminance (cd/m2) |
376 |
|
Black Point (cd/m2) |
0.18 |
|
Contrast Ratio |
2099:1 |
|
Colour
Space Measurements |
|
|
sRGB coverage |
127.0% |
|
DCI-P3 coverage |
93.6% |
|
Rec.2020 coverage |
67.2% |
|
Initially out of the box the screen was set
with a high 100% brightness and so was overly bright and uncomfortable to use, so you will
definitely need to turn that down. The colours looked bright and vivid and you
could tell they were boosted a little compared with a standard sRGB screen we
had set up next to it. The colours felt perhaps a little warm and contrast ratio
seemed good thanks to the VA panel
being used.
We went
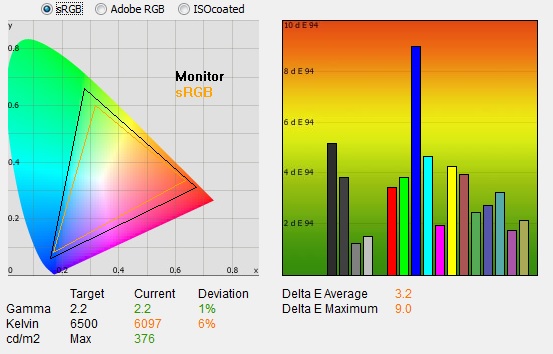
ahead and measured the default state with the i1 Pro 2. The
CIE diagram
on the left of the image confirms that the monitors colour gamut (black
triangle) extends a fair amount beyond sRGB colour space (orange triangle),
particularly in green shades. There is some minor over-coverage in blue shades,
and a little more in reds but it's not quite a full wide gamut screen. Thanks to
the Quantum Dot film, it's somewhere in-between. We measured using ChromaPure software a
127.0% sRGB gamut coverage so it was stretching a fair amount beyond the typical sRGB
reference, as advertised. This measured colour space coverage corresponds to 93.6% of
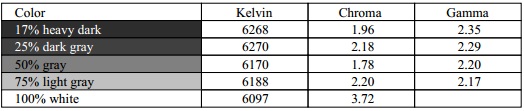
the DCI-P3 reference which meets the Ultra HD Premium defined spec for HDR content, and 67.2% of the Rec.2020 reference.
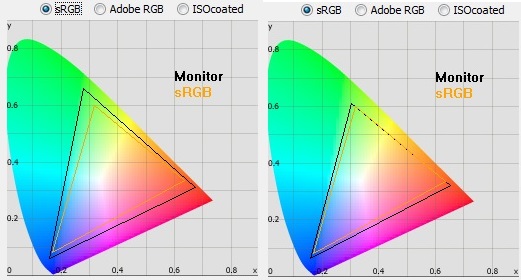
sRGB gamut
coverage in default custom mode (left) vs sRGB preset color mode (right)
There is an sRGB mode available in the 'color'
section of the OSD
menu which restricts the colour space and bring it closer to the sRGB
reference. You can see that comparison of the measured colour space in the CIE
diagrams above, where the sRGB preset mode more closely matches the sRGB
reference. This cuts down the slight oversaturation in greens and reds and might
be useful if you are doing some more colour critical work and need to work more
closely with sRGB content. In that mode we measured 104.9% sRGB coverage (77.3% of DCI-P3 and
55.5% Rec.2020) which is much nearer to sRGB than the default 127.0% sRGB
coverage in the 'custom' mode. There are some OSD settings which are locked in
this preset mode, but thankfully brightness is still available so you can set
the screen to a comfortable brightness level. This at least makes this mode
useable. Handy to have it available as an option for more precise sRGB
emulation.
Default gamma (in both custom and sRGB modes) was recorded at 2.2 average,
leaving it with a very small 1% deviance
from the target which was good news. White
point was measured at a slightly warm 6097k which left it 6%
out from the 6500k we'd ideally want for desktop use. There are a range of other
colour temp presets available in the menu along with a user configurable mode
where you have access to the individual RGB channels for the
calibration
process.
Luminance was recorded at an extremely bright
376
cd/m2
which is too high for prolonged general use, you will definitely need to turn
that down. The screen was set at a default
100% brightness in the OSD menu but that is easy to change of course to reach a
more comfortable setting without impacting any other aspect of the setup. The
black depth was 0.18 cd/m2 at this default
maximum brightness setting, giving us a very good static contrast ratio of
2099:1 which was a little lower than the specified 2400:1 "minimum" figure from
Samsung.
Colour accuracy was moderate out of the box
with an average dE of 3.2, but a max of 9.0 where blue shades seem to be an
issue. Still on average within the factory calibration targets. Testing the screen with colour
gradients showed smooth gradients with only minor gradation evident in darker
tones. There was no sign of any colour banding which was good news.
All in all the factory calibration seemed to
be pretty good. Gamma and dE targets were achieved, and white point was only a
small 6% out from the target. We had a wider colour gamut as advertised,
extending to 127% sRGB and the VA panel contrast ratio was high.
Calibration
We used the
X-rite i1 Pro 2
Spectrophotometer combined with the LaCie Blue Eye Pro software package to
achieve these results and reports. An X-rite i1 Display Pro colorimeter was used
to validate the black depth and contrast ratios due to lower end limitations of
the i1 Pro device.
Samsung
C32HG70
Calibrated Settings
|
 |
|
Monitor OSD
Calibrated Settings |
|
Picture Mode |
Custom |
|
Brightness |
31 |
|
Contrast |
75 |
|
Gamma |
Mode1 |
|
Color Tone |
Normal |
|
RGB |
49, 50, 55 |
|
Luminance
Measurements |
|
|
luminance (cd/m2) |
120 |
|
Black Point (cd/m2) |
0.05 |
|
Contrast Ratio |
2322:1 |
|
Colour
Space Measurements |
|
|
sRGB coverage |
127.0% |
|
DCI-P3 coverage |
93.6% |
|
Rec.2020 coverage |
67.2% |
|
We adjusted the RGB
channels and brightness setting as shown in the table above as part of the
guided calibration process. These OSD
changes allowed us to obtain an optimal hardware starting point and setup before software level changes would be
made at the graphics card level. We left the LaCie software to calibrate
to "max" brightness which would just retain the luminance of whatever brightness
we'd set the screen to, and would not in any way try and alter the luminance at
the graphics card level, which can reduce contrast ratio. These adjustments
before profiling the screen would help preserve tonal values and limit
banding issues. After this we let the software carry out the LUT adjustments and create an
ICC profile.
Average gamma was maintained at 2.2
average and corrected the minor 1% deviance we'd seen out of the box. The
white point had now been corrected to 6486k, which addressed the slightly warm
6% deviance
we'd seen before. Luminance had
been improved thanks to the adjustment to the brightness control and was now
being measured at a far more comfortable 120
cd/m2.
This left us a black depth of 0.05 cd/m2 and created a slightly stronger static
contrast ratio (than default) of
2322:1, bringing us closer to the minimum advertised spec of 2400:1. Colour accuracy of the resulting
profile was excellent, with dE average of 0.6 and maximum of 1.2. LaCie would
consider colour fidelity to be very good.
Testing the screen with various colour
gradients showed mostly smooth transitions with only some minor gradation in
darker tones. There was no added banding thankfully which can sometimes be
caused by adjustments to the
graphics card LUT from the profiling of the screen.
You can use our settings and
try our calibrated ICC profile if you wish, which are available in
our ICC profile database. Keep in mind that results will vary from one
screen to another and from one computer / graphics card to another.
Calibration Performance Comparisons
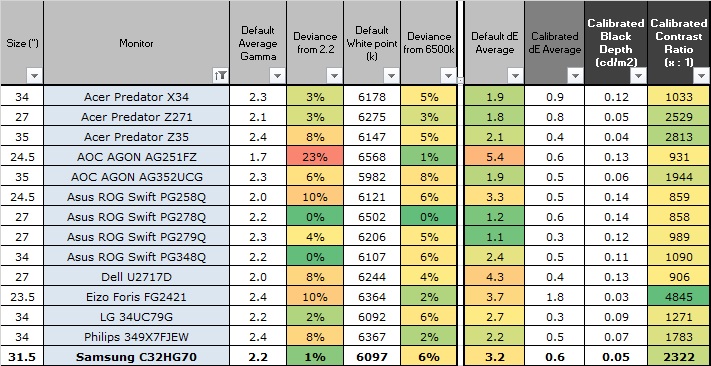
The comparisons made in this section try to give
you a better view of how each screen performs, particularly out of the box which
is what is going to matter to most consumers. When comparing the default factory
settings for each monitor it is important to take into account several
measurement areas - gamma, white point and colour accuracy. There's no point
having a low dE colour accuracy figure if the gamma curve is way off for
instance. A good factory calibration requires all 3 to be well set up. We have
deliberately not included luminance in this comparison since this is normally
far too high by default on every screen. However, that is very easily controlled
through the brightness setting (on most screens) and should not impact the other
areas being measured anyway. It is easy enough to obtain a suitable luminance
for your working conditions and individual preferences, but a reliable factory
setup in gamma, white point and colour accuracy is important and not as easy to
change accurately without a calibration tool.
From these comparisons we can also compare the
calibrated colour accuracy, black depth and contrast ratio. After a calibration
the gamma, white point and luminance should all be at their desired targets.
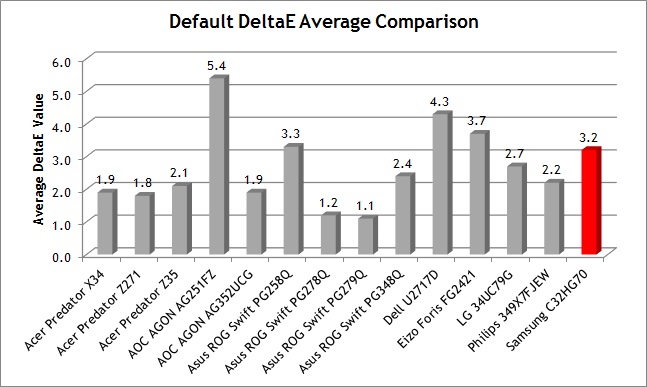
Default setup of the screen out of the box
was pretty decent thanks to the factory calibration. Gamma was accurate at 2.2
with only a very minor 1% deviance which was great news as that can be a tricky
area to correct if you don't have a calibration device. White point was only a
small amount off the 6500k target (6% deviance) and easy to correct with some
basic RGB adjustments in the OSD menu. Contrast ratio was strong thanks to the
VA panel, even better after calibration and close to the minimum contrast ratio
spec from Samsung. You also have a useable and pretty good sRGB emulation mode
if you need to tone down the colour gamut at all from the default Quantum-Dot
extended 127% sRGB coverage.
The display was good when it came to static
contrast ratio compared with most of the other models shown here. We measured a
2322:1 calibrated contrast ratio which was certainly a lot higher than you can
achieve from an IPS or TN Film panel (about 1100:1 maximum from those
technologies). However, at 2322:1 it did fall a bit short of the specified
3000:1 'typical' figure, although was basically in line with the 'minimum' contrast
ratio spec provided. It left it a little
behind some other VA panels we've tested such as the Acer Predator Z35 (2813:1)
and the Eizo Foris FG2421 (4845:1). As a reminder, this is the static contrast
ratio for SDR (Standard Dynamic Range) content, and higher contrast ratios will
be possible when viewing HDR content thanks to the local dimming technology.
More on that later.
|
Check Pricing and Buy - Direct Links
|
|
Amazon
|
|
TFTCentral is a participant
in the Amazon Services LLC Associates Programme, an affiliate
advertising programme designed to provide a means for sites to earn
advertising fees by advertising and linking to Amazon.com, Amazon.co.uk,
Amazon.de, Amazon.ca and other Amazon stores worldwide. We also
participate in a similar scheme for Overclockers.co.uk. |
Viewing Angles
Above: Viewing
angles shown from front and side, and from above and below. Click for
larger image
Viewing angles of the screen were fairly
typical for a VA technology panel although better than some other VA panels
we've seen of late. The viewing angles here were quite similar to the
Acer Predator Z271 which had a 27" sized curved Samsung SVA panel, but they
were better than a 34" ultrawide SVA panel from Samsung that was used in the
Philips 349X7FJEW. So it does seem that VA viewing angles can vary depending
on panel size at the moment.
The image became more washed out as you
viewed it from a wide angle horizontally, and certainly vertical shifts were
even more noticeable with some yellowy colour tone shift evident. The viewing
angles were not as good as you will get from an IPS-type panel, but they are
better than you will see from TN Film matrices. Somewhere in the middle is VA.
Users should also be aware that the panel
exhibits the off-centre contrast shift which is inherent to the VA pixel
structure. When viewing a very dark grey font for example on a black background,
the font disappears when viewed head on, but gets lighter as you move slightly
to the side. This is an extreme case of course as this is a very dark grey tone
we are testing with. Lighter greys and other colours will appear a little darker
from head on than they will from a side angle, but you may well find you lose
some detail as a result. This can be particularly problematic in dark images and
where grey tone is important. It is this issue that has led to many graphics
professionals and colour enthusiasts choosing IPS panels instead, and the
manufacturers have been quick to incorporate this alternative panel technology
in their screens. We would like to make a point that for many people this won't
be an issue at all, and many may not even notice it. Remember, many people are
perfectly happy with their TN Film panels and other VA based screens. Just
something to be wary of if you are affected by this issue or are doing colour
critical work.

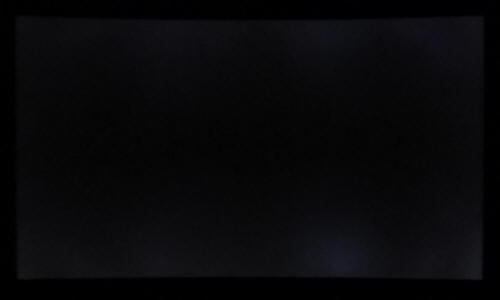
Above: View of an
all black screen from the side. Click for larger version
We captured a photo of an all-black image as
viewed from a side angle as shown above. This can help exhibit any glow you
might see on different panel technologies. Here we saw some pale glow in places
along the top and bottom but this was more related to uniformity issues that we
will look at it a moment. There was no purple glow like we have seen on some
other Samsung SVA panels including the 34" ultrawide
Philips 349X7FJEW recently. It was also much less than the obvious white
glow you get from most IPS panels.
Panel Uniformity
We wanted to test
here how uniform the brightness was across the screen, as well as identify any
leakage from the backlight in dark lighting conditions. Measurements of the
luminance were taken at 35 points across the panel on a pure white background.
The measurements for luminance were taken using BasICColor's calibration
software package, combined with an X-rite i1 Display Pro colorimeter with a
central point on the screen calibrated to 120 cd/m2. The below
uniformity diagram shows the difference, as a percentage, between the
measurement recorded at each point on the screen, as compared with the central
reference point.
It is worth
noting that panel uniformity can vary from one screen to another, and can depend
on manufacturing lines, screen transport and other local factors. This is only a
guide of the uniformity of the sample screen we have for review.
Uniformity of Luminance
Uniformity of the screen was pretty good, with only small areas of the
screen extending beyond a 10% deviance threshold which we would consider
decent. The left hand side of the screen seemed to be slightly brighter than
the right, ranging up to 126 cd/m2 maximum, but that is only
about 5% deviance from the centrally calibrated point so nothing you would
notice in practice. The upper and lower edges showed a slight drop off in
luminance, down to 105 cd/m2 minimum (-14% deviance). Around 86%
of the screen was within a 10% deviance from the centrally calibrated point
which was good.
Backlight Leakage
Above: All black screen in a darkened room. Click for larger version
We also tested the screen with an all black image
and in a darkened room. A camera was used to capture the result. The camera
showed there was some clouding in some parts of the screen along the top and
bottom edges, particularly on the right hand half of the screen. It was
noticeable in a couple of areas in particular but it was not too bad. It would
be difficult to spot this during any normal uses really, unless you're viewing a
lot of dark content. The VA panel helped produce nice deep blacks though in this
test.
Note: if you want to test your own screen for
backlight bleed and uniformity problems at any point you need to ensure you have
suitable testing conditions. Set the monitor to a sensible day to day brightness
level, preferably as close to 120
cd/m2 as you can get it (our tests are
once the screen is calibrated to this luminance). Don't just take a photo at the
default brightness which is almost always far too high and not a realistic usage
condition. You need to take the photo from about 1.5 - 2m back to avoid
capturing viewing angle characteristics, especially on IPS-type panels where
off-angle glow can come in to play easily. Photos should be taken in a darkened
room at a shutter speed which captures what you see reliably and doesn't
over-expose the image. A shutter speed of 1/8 second will probably be suitable
for this.
General and Office Applications
The screen features a 2560 x 1440 resolution
which is fairly common nowadays, but the difference here is that it is on a
slightly larger screen size than normal. The C32HG70 is 31.5" in size, making it
4.5" larger diagonally than the typical 27" models featuring this resolution.
The larger screen size is designed to provide more immersion for multimedia and
games, giving a bigger screen to look at, especially useful if you want to
view it from a little further back than a typical PC viewing position. So how
does this 2560 x 1440 resolution look on this larger screen? Well, it looks
fine. You will see slightly larger font sizes of course with the 0.272mm pixel
pitch here and so for office work it doesn't look quite as sharp as on a 27"
model. Some people may even prefer this slightly larger font though for more
comfortable reading, and it's certainly not too big we didn't think for a screen
this size. We saw no issues with text clarity on this screen, which some users
had reported to us. Perhaps this was addressed via one of the firmware updates
along the way, but we didn't see any problems with clarity.
We liked the curved format of the display
actually for day to day office work. It just felt a bit more comfortable than a
flat screen on a model this size, bringing the corners a bit nearer to you. You
didn't really notice the curve in normal use but we liked the feel. Probably
down to user taste, so if in doubt try and see one in person. It is funny
switching back to a flat display afterwards which appears at first to curve away
from you. You do quickly get used to the curved format of this model.
The light AG coating of the VA panel doesn't
produce any graininess to the image like some aggressive AG solutions can and so
white office backgrounds look clean and clear. The viewing angles of the VA
panel technology were moderate, providing a fairly stable images from different
angles, although not as good as you can get from competing IPS based displays.
There is some contrast and colour tone shift from wider angles and the image
starts to become washed out. It was better though than some other VA panels we
have tested. The off-centre VA contrast shift may also be a
problem for colour critical work and photo editing and you may want to consider
an IPS equivalent instead if that is your primary usage. The viewing angles are
fine though here for general day to day and office work.
The default
setup of the screen was good and represented a decent setup for most users. You
can make a few simple RGB adjustments to bring the white point more in line, but
the rest of it was pleasing. Especially considering this is a gaming screen and
those are often set up very differently. No super-low gamma settings here! The 2322:1 calibrated
contrast ratio was strong and certainly a strength of the VA panel technology,
although a little disappointing given the expectations of the 3000:1
'typical' specification listed. Nevertheless it certainly exceeded anything possible from
competing IPS displays in this size.
The
brightness range of the screen was also very good, with the ability to offer a
luminance between 357 and 21 cd/m2. This should mean the screen is
perfectly useable in a wide variety of ambient light conditions, including
darkened rooms. A setting of ~33 in the OSD brightness control should return you
a luminance close to 120 cd/m2 out of the box. However, one issue
with this screen is that the brightness regulation is controlled through the use of
the now infamous
Pulse-Width Modulation (PWM), and so those who suffer from eye fatigue or
headaches associated with flickering backlights may have some issues. It is odd
that this technique was used, and we have flagged it to Samsung.
There was no
audible noise from the screen, even if you listened very closely and when testing patterns which sometimes cause these issues to become noticeable.
The screen also remains cool even during prolonged use.
There is a
special 'Eye Saver' mode available via the OSD menu (and quick launch using the
'right' direction shown above) which is designed to offer
an "optimum picture quality suitable for eye relaxation" according to the user
manual. It is supposed to reduce the blue light output of the screen. In
practice, we found this to be quite an odd setting. First of all when you enable
the setting the brightness control is locked. The screen goes more yellowy and
pale, and appears to be more washed out. With the brightness control disabled,
the luminance output is measured at 83 cd/m2 and for some reason this
mode seems to be artificially lowering the digital white point. Blacks become
more grey, and we measured black at only 1.03 cd/m2 giving us an
extremely low 81:1 contrast ratio. We're not really sure what this mode is
trying to do, but it didn't seem to be very useful.
The screen offers 2x USB 3.0 ports which can
be handy, including one with fast charging support. They are all located on the
back of the display so are not easy-access really. There are no integrated
speakers, but headphone output connection is provided along with mic in/mic out if you need them. There
are no further extras like ambient light sensors or card readers which can be
useful in office environments. Remember this is gamer-orientated screen anyway. There was a
good, wide range of ergonomic
adjustments available from the stand with the important tilt, height and swivel
adjustments available. You can quite easily obtain a comfortable
position for a wide variety of angles although tilt and height were stiff so you
might not want to move it around too often. The VESA mounting support may also
be useful to some people as well for more flexibility especially given the deep
profile of the screen and stand.
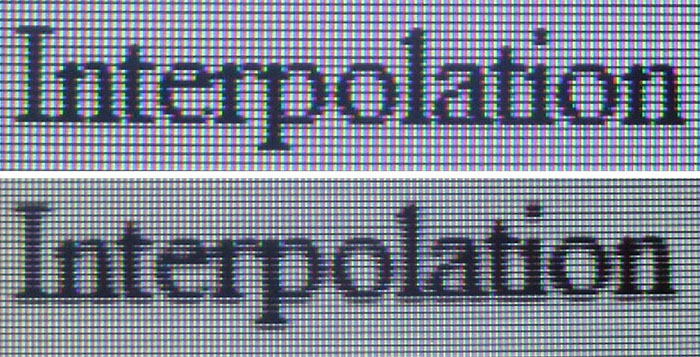
Above: photo of text at 2560 x 1440 (top) and 1920 x 1080 (bottom)
The screen is designed to run at its native
resolution of 2560 x 1440 and at a up to 144Hz maximum native refresh rate. However, if
you want you are able to run the screen outside of this resolution. We tested
the screen at a lower 1920 x 1080 resolution to see how the screen handles the
interpolation of the resolution, while maintaining the same aspect ratio of
16:9. At native resolution the text was sharp and clear. When running at a the
lower resolution the text becomes noticeably more blurry. You lose a lot of screen real-estate as well of course but
if your system struggles with the higher refresh rates it might be an option for
gaming. It's better to stick with the native resolution if you can though.
Responsiveness and Gaming
|
Quoted G2G Response Time |
1ms (MPRT) |
|
Quoted ISO Response Time |
n/a |
|
Panel Manufacturer and
Technology |
Samsung SVA (VA-type) |
|
Panel Part |
LSM315DP01 |
|
Overdrive Use |
Yes |
|
Overdrive Control
Available Via Setting |
Not as such (see
explanation below) |
|
Overdrive Settings |
n/a |
|
Refresh Rate Range
(firmware v1013.0) |
Standard Mode
DisplayPort 120 - 144Hz
HDMI 80 - 100Hz
Ultimate Mode
DisplayPort 72 - 144Hz
HDMI
50 - 100Hz
|
|
Variable Refresh Rate
technology |
FreeSync 2 |
The C32HG70 is rated by Samsung as having a
1ms response time. This is quoted in a slightly different way to most of the
monitor market as it is specifically a MPRT (Motion Picture Response Time)
classification, which is a system used to try and articulate the responsiveness
of a panel in the way it is perceived by the user, as opposed to looking at grey
to grey (G2G) measurements or anything like that. Some manufacturers quote MPRT
measurements, but also provide a comparative G2G figure, since that is used
widely across the market at the moment. On this screen, there is no G2G figure,
and the fact they are quoting 1ms MPRT relates to the use of a strobed backlight
system - more on that in a moment.
Given this different way to quote a response
time, it is a little unclear then whether
overdrive / response time compensation (RTC) technology is being used to boost pixel
transitions across grey to grey changes. Usually a G2G figure is a clear sign
that overdrive is being used on the panel. Given this is a VA technology panel
from Samsung, which can be quite slow if you don't apply overdrive to it, it is
safe to assume there is an overdrive impulse applied here on the C32HG70 in some
way.
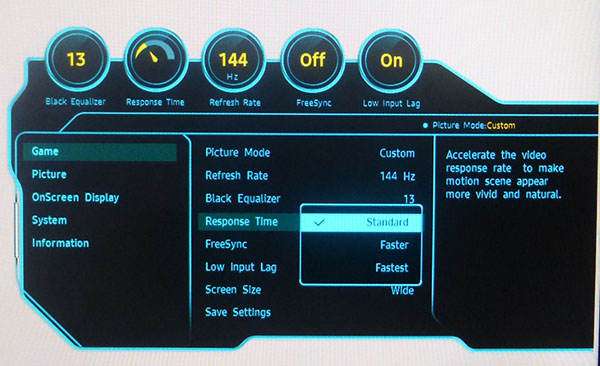
There is a user control in the OSD menu
labelled as 'Response time' but contrary to expectation this does not actually
control the overdrive or affect pixel response times. There are 3 modes
available - standard, faster, fastest. The faster and fastest modes actually
enable a strobed backlight system to improve the motion clarity, giving rise to
the 1ms MPRT spec being quoted. So there is actually no control over the
overdrive and pixel response times, only control over a standard mode (strobing
off) and two slightly different strobing modes. We will look at all of this in
more detail in a moment but we are reliant here on the preset overdrive levels
from Samsung.
The part being used is the
Samsung LSM315DP01 SVA (VA-type) technology panel. We will first test the screen using our
thorough
response time testing method. This uses an oscilloscope and photosensor to
measure the pixel response times across a series of different transitions, in
the full range from 0 (black) to 255 (white). This will give us a realistic view
of how the monitor performs in real life, as opposed to being reliant only on a
manufacturers spec. We can work out the response times for changing between many
different shades, calculate the maximum, minimum and average grey to grey (G2G)
response times, and provide an evaluation of any overshoot present on the
monitor.
We use an
ETC M526
oscilloscope for these measurements along with a custom photosensor device.
Have a read of
our response time measurement article for a full explanation of the testing
methodology and reported data.
Response Times
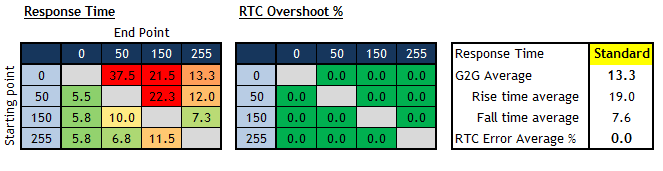
First of all we tested the screen in the
'standard' response time setting. This disables the strobed backlight system,
allowing us to measure the actual pixel response times across a range of G2G
transitions. We tested the screen in this 'standard' mode at a range of refresh rates
from 60 to 144Hz, which all returned the same results from pixel response times
as shown above.
As you can see, response times were somewhat
mixed. Transitions from black to grey were particularly slow, a common issue
with VA-type panels and something we've seen many times before and from most VA
panels. For instance the change from black to dark grey (0 > 50) was measured at
37.5ms.

Pursuit
camera tests demonstrating real perceived blurring levels. Note the dark
trailing particularly on darker backgrounds due to slow rise times
In practice, this meant that you could see some issues with black
smearing on moving content which you can see in our pursuit camera tests above. This was particularly problematic with darker backgrounds. Transitions from light to dark (fall times) were much better thankfully,
with an average of 7.6ms G2G measured. It was the slow changes from dark to
light (rise times) that were the issue here at 19ms average, dragging the overall
combined response time
average down to 13.3ms G2G.
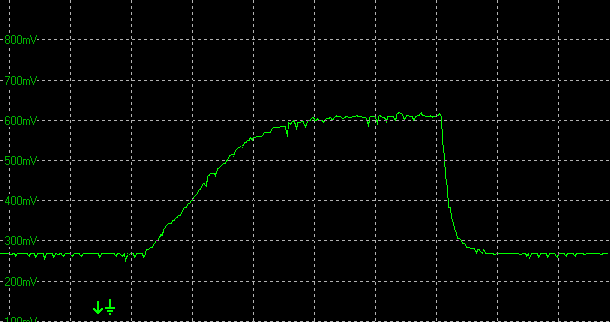
0-50-0
transition example showing slow rise time. Horizontal scale 20ms
This gives rise to another problem, when it
comes to refresh rate. This is a native 144Hz capable panel, but for high
refresh rates to function correctly you need to have response times that can keep
up with the frame rate demands. At 144Hz for instance, a new frame is being sent
to the screen every 6.94ms (144 frames per second). The pixel response times
need to be able to keep up with the frame rate or you will often see additional
motion blurring and smearing. So here on the C32HG70 if we are generous and
ignore the particularly slow transitions, the average G2G response time would be
about 8.7ms. That is fast enough to support up to 100Hz just about, but anything
higher than that will lead to added smearing and blurring. The response times
are just not fast enough to keep up with the frame rates of
anything above 100Hz. You would
probably be best to limit your maximum refresh rate if you are using this
'standard' mode to 100Hz via the OSD menu option. We have fed this back to
Samsung so perhaps it will be possible for them to make overdrive adjustments in
future firmware versions.
Detailed Response Time Measurements
Having taken a small number of measurements above to test the response times at
each refresh rate, we extended the range of transitions measured here. As a
reminder there is actually no control over the response times themselves, and
they remain the same in each of the three 'response time' modes in the OSD menu. The
'faster' and 'fastest' modes don't change the underlying pixel response times,
they just enable the strobing backlight which we will talk about in more detail
in a moment. The pixel response times also stay consistent at all refresh rates
from 60Hz to 144Hz.
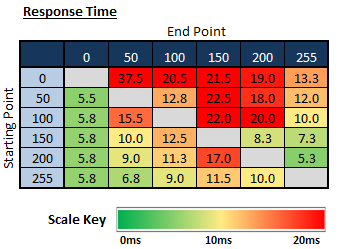
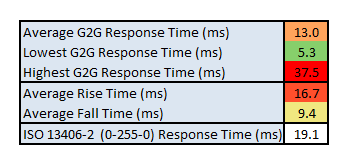
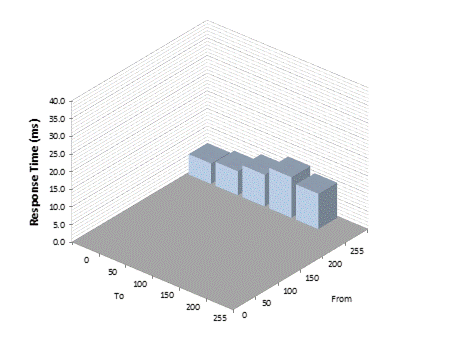
The average G2G response time was more accurately
measured at 13.0ms which was quite slow overall to be honest. It is the rise
times, the changes from dark to light shades, that cause the problem here and you
can see that those response times are particularly slow. The changes from black
to grey (0 > x) are around 20ms in most cases, with a change from black to dark
grey (0 > 50) being even slower at 37.5ms. Those slow rise times are what leads
to the black smearing on moving content that we talked about before, and
demonstrated with our pursuit camera tests. We have seen this issue on many VA
panels in the past, as those changes from black to grey often seem to be a
problem with this technology it seems. You need a more aggressive overdrive
impulse to boost them to faster speeds.
The rise times (16.7ms G2G average) drag the overall average
response times down to the 13ms G2G figure. The fall times, changes from light
to darker shades are much quicker with an average of 9.4ms G2G measured. With
the overall response times being what they are, we felt that without the strobing
backlight active (so in the 'standard' response time setting) you will probably
want to limit your refresh rate to 100Hz maximum. That includes when using
FreeSync to dynamically control the refresh rate range. There seemed to be some
motion clarity improvements going from 60Hz to 100Hz thanks to the higher frame
rate, but if you push the refresh rate above 100Hz you do start to get some
additional blurring and smearing caused by the slow pixel response times. If you
use the strobing backlight, that helps hide some of the blurring and smearing
and so is more usable at 120Hz and 144Hz settings if you wish.
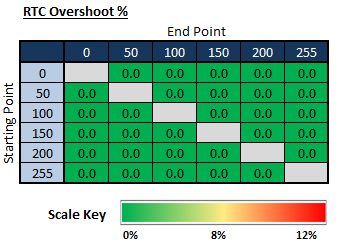
On a positive note, there is no overshoot at
all on any transition so at least there was no added trailing or artefacts from
an overly aggressive overdrive impulse. If anything, they can afford to turn the
overdrive up to boost pixel response times here.
FreeSync 2
|
FreeSync Mode |
Interface |
Refresh Range |
|
Standard Mode |
DisplayPort |
120 - 144Hz |
| |
HDMI |
80 - 100Hz |
|
Ultimate Mode |
DisplayPort |
72 - 144Hz |
| |
HDMI |
50 - 100Hz |
On this model, FreeSync is
supported over the DisplayPort and both HDMI interfaces. The FreeSync modes need to be
enabled via the OSD menu, but when you activate either of the modes offered, the response
time setting is locked out and reverts to the 'standard' mode. This is because
the 'faster' and 'fastest' modes are actually operating a strobed backlight, and
that cannot function at the same time as a variable refresh rate unfortunately.
So with FreeSync turned on, you are left with the response times and motion
clarity issues we talked about earlier. There are some very slow transitions
from black > grey shades which results in dark smearing in certain content. And
because the response times are not fast enough across the board, they can only
really handle a refresh rate up to 100Hz before additional frame rate related smearing and blurring starts to
become an issue as well.
You will probably want to limit your FreeSync
upper refresh rate to 100Hz we think which still offers improvements over common
60Hz screens, and is of course a lower demand then on your system and graphics
card when trying to run at the full 2560 x 1440 resolution and maximum 144Hz
refresh rate.
The FreeSync range
of the screen varies depending on which FreeSync mode you select in the OSD
menu, with two options available for 'Standard' and 'Ultimate'. The ranges
listed in the table above are based on the current latest v1013.0 firmware and
you can see that the ultimate mode gives you a much wider range in which to
operate. This is the recommended option to use if you are going to use FreeSync,
and actually the range of 50 - 100Hz over HDMI is probably preferable to account
for the
previously mentioned motion clarity considerations. The 'Standard' mode is
designed to give a more limited range if for any reason you experience any
issues with artefacts, flicker or any other oddities in the Ultimate mode. That
might vary from system to system and from game to game, so it's there just as a
fall back which is handy.
Strobed Backlight and Motion
Clarity
A strobing backlight is used on a display to reduce
the
perceived motion blur in practice, helping to improve motion clarity and make it
easier to track moving objects on an LCD screen. Have a read of our detailed
article about motion blur reduction backlights for more information or if
you're unfamiliar with these technologies and why they are used.
We tested the strobed
backlight system on the C32HG70 to see what impact it has on motion clarity. On
the CHG70 series this operates a little differently than we've seen on other
screens in the past. The strobing is actually enabled when you switch up to the
'faster' or 'fastest' settings in the Response Time control. This doesn't change
the pixel response times as the name might imply, but instead enables the blur
reduction strobing backlight system. Underlying pixel response times remain
unaffected, but you do see some improvements in perceived motion clarity.
Faster Setting
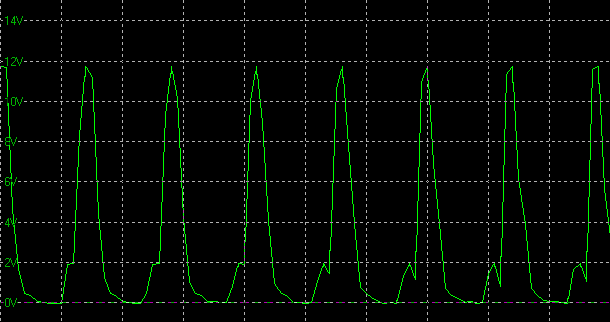
Strobing
backlight cycling, 144Hz
(scale = 5ms)
When you change to the 'Faster' response time
mode the brightness setting is disabled, and the screen is actually set to its
maximum brightness output. This avoids the PWM backlight dimming we know is
active when you move the brightness control below 100%, to avoid any conflicts
with the on/off strobing of the backlight here for motion benefits. This also helps
provide a decent luminance since the strobing system results in a drop from the
default maximum luminance. So when you enable the 'faster' mode, luminance drops
from the maximum 357 cd/m2 we see in the 'standard' setting (where strobing
backlight is off), down to 211 cd/m2. This is a good luminance for a strobed
backlight system actually, surpassing many screens we've tested in the past
which are often criticised for being too dark in these blur reduction modes.
However, it is a shame that you cannot manually adjust the brightness down from
there if you wanted to, but it's presumably a complication because of the PWM
backlight dimming. You may need to alter brightness digitally through your
graphics card or game setting if you need it to be lower, although that will
crush the contrast ratio somewhat.
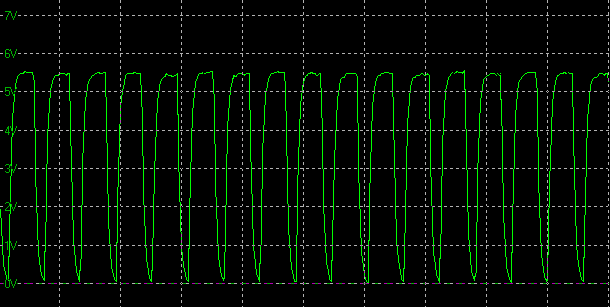
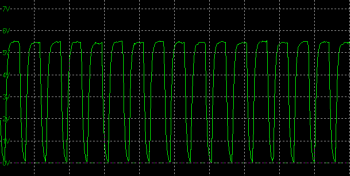
The strobing operates in sync with the 144Hz
refresh rate as shown from the oscillograph above. The backlight is turned off
once per frame, so at 144Hz that is every 6.94ms. This strobing in sync with the
frame rate delivers optimal blur reduction benefits and avoids any issues with
ghosting images or stutter that can appear if they are not in sync. We noticed
that the strobing actually stays at 144Hz even if you change your refresh rate
setting in Windows down to something lower. For example if you change your
windows refresh rate to 100Hz, the strobing still operates at 144Hz. If you want
to sync the strobing to a lower refresh rate this has to be done via the OSD
menu on the monitor itself, using the additional 'Refresh Rate' setting. Here you can set the refresh
rate of the monitor, and the strobing then syncs up to that. This works
at the settings of 144Hz, 120Hz and 100Hz but if you switch to the 60Hz mode the
strobing is not available. At 60Hz the 'faster' and 'fastest' response time
settings are greyed out and not available, so you cannot use strobing at a 60Hz
rate.
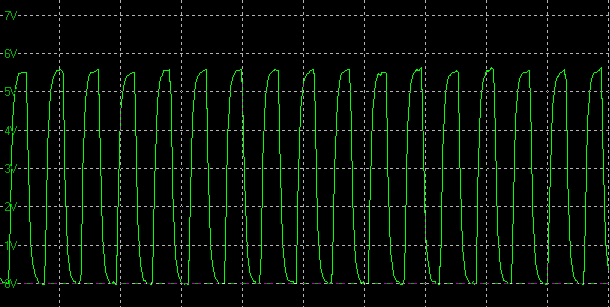
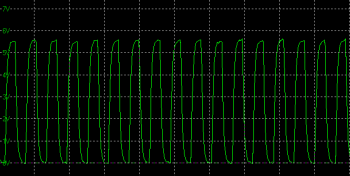
Fastest Setting
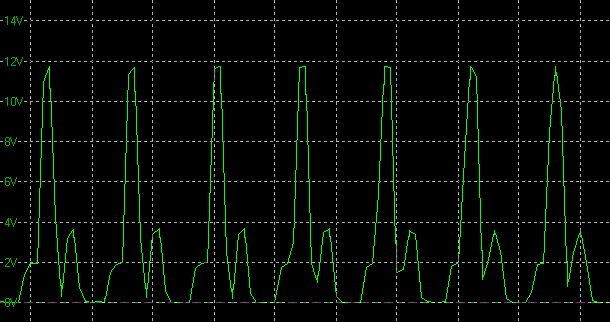
Strobing
backlight cycling, 144Hz
(scale = 5ms)
When you enable the 'fastest' response time
setting there is a small change to the behaviour of the strobing. You can see a
small second strobe is introduced per frame from the oscillograph. The strobing
is still in sync with the refresh rate you set in the monitor OSD and we didn't
notice much real change in practice to be honest. The maximum luminance was the
same as the 'faster' mode, and there was minimal change to the perceived motion
clarity. See our pursuit camera tests in a moment for more info. You may want to
try both modes to see which one you prefer, but there didn't seem to be any
significant difference.
Maximum Blur Reduction Brightness - Display
Comparison
For ease of reference we have
also provided a comparison table below of all the blur reduction enabled
displays we've tested, showing their maximum luminance before blur reduction is
turned on (normal mode) and their maximum luminance with the feature enabled.
This will give you an idea of the maximum brightness you can expect from each
model when using their blur reduction feature, if that is important to you. A
lot of people want a brighter display for gaming and sometimes the relatively
low maximum luminance from blur reduction modes is a limitation.
These comparisons are with the refresh rate as
high as is available for the blur reduction feature to function. For most this
is at 120Hz, but some also support the feature at higher. You can achieve a
slightly brighter display if you use the feature at lower settings like 85 or 100Hz
if available, since the
strobes are less frequent, but it's not a significant amount. That can also
introduce more visible flicker in some situations.
|
Model |
Refresh Rate |
Max Normal
Luminance
Blur Reduction Off
(cd/m2) |
Max Luminance
Blur Reduction On
(cd/m2) |
|
Acer XB270HU* |
100Hz* |
327 |
111 |
|
Acer Predator Z35 |
120Hz |
359 |
111 |
|
Asus ROG Swift PG258Q |
144Hz |
488 |
275 |
|
Asus ROG Swift PG278Q |
120Hz |
385 |
123 |
|
Asus ROG Swift PG279Q |
120Hz |
331 |
101 |
|
BenQ XL2720Z |
144Hz |
282 |
119 |
|
BenQ XL2730Z |
120Hz |
309 |
191 |
|
Dell S2716DG |
120Hz |
328 |
118 |
|
Eizo FG2421 |
120Hz |
386 |
257 |
|
Eizo FS2735 |
144Hz |
331 |
180 |
|
LG 34UC79G |
144Hz |
267 |
141 |
|
LG 38UC99 |
75Hz |
308 |
213 |
|
Samsung C32HG70 |
144Hz |
357 |
211 |
Note:
Pulse Width setting at max where applicable.
*Note 2: The Acer XB270HU was later updated to include a 120Hz mode, which will produce a
slightly darker maximum luminance
Pursuit Camera Tests - Motion Clarity
We've already tested above the actual
pixel response
times and other aspects of the screen's gaming performance. We wanted to
carry out some pursuit camera tests as well to give an even more complete idea
of the performance of this screen.
Pursuit cameras are used to capture motion
blur as a user might experience it on a display. They are simply cameras which
follow the on-screen motion and are extremely accurate at measuring motion blur,
ghosting and overdrive artefacts of moving images. Since they simulate the eye
tracking motion of moving eyes, they can be useful in giving an idea of how a
moving image appears to the end user. It is the blurring caused by eye
tracking on continuously-displayed refreshes (sample-and-hold) that we are keen
to analyse with this new approach. This is not pixel persistence caused by
response times; but a different cause of display motion blur which cannot be
captured using static camera tests. Low response times do have a positive impact
on motion blur, and higher refresh rates also help reduce blurring to a degree.
It does not matter how low response times are, or how high refresh rates are,
you will still see motion blur from LCD displays under normal operation to some
extent and that is what this section is designed to measure. Further
technologies specifically designed to reduce perceived motion blur are required
to eliminate the blur seen on these type of sample-and-hold displays which we
will also look at.
We used the
Blurbusters.com Ghosting Motion Test which is designed to be used with
pursuit camera setups. The pursuit camera method is
explained at BlurBusters
as well as
covered in this research paper. We
carried out the tests at 144Hz refresh rate, with and without Blur Reduction
enabled. These UFO objects were moving horizontally at 960 pixels per second, at
a frame rate matching refresh rate of the monitor.
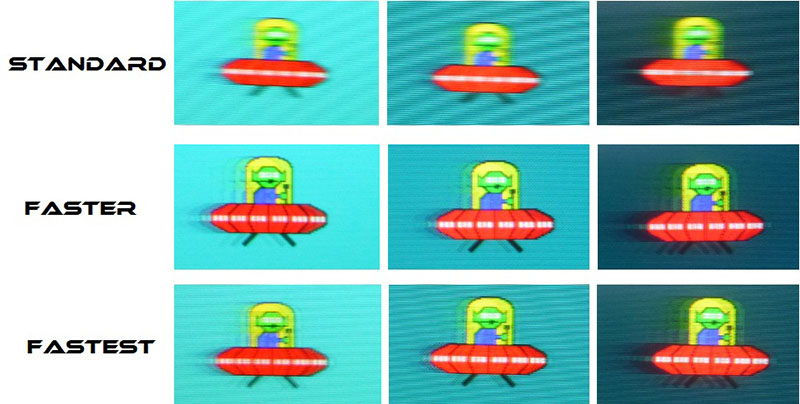
We were very pleased with the results here as
we had been on other blur reduction displays when the strobed backlight was
enabled, with an obvious and marked improvement in perceived motion blur
experienced. Tracking of moving objects became much easier and the image looked
sharper and clearer when you used the 'Faster' and 'Fastest' modes which enabled
the strobing. You can see from the pursuit camera tests the difference the
strobed backlight makes - remember, these images are meant as a representation of what you
would actually see with the eye. In the 'standard' mode where strobing was not
active, you get a typical amount of motion blur, but the image becomes much
sharper, clearer and easier to track once it is enabled.
One thing you will notice in particular on
the dark background images is that there is some noticeable dark smearing behind
the moving UFO. This is a result of those particularly slow
pixel response times
when changing from dark > light shades that we talked about earlier. This is a
problem in all settings and is not eliminated sadly by the strobed backlight.
It's a fairly common issue on VA panels to be honest. Maybe Samsung can improve
the response times with a future firmware update if we are lucky.
We also used the BlurBusters full-screen
TestUFO strobe
crosstalk test as well to put the feature through its paces and were fairly pleased
with the results. The upper half of the screen was clearer than the
bottom, and in the bottom third of the screen some strobe cross-talk became
pretty apparent. It is impossible to eliminate strobe cross-talk completely due to the
way they operate, but the important thing is whereabouts on the screen this
manifests itself and to what level. The central region (as pictured above) is
probably the most important since that's where a lot of your gaming focus will
be, where crosshairs and the likes are. We were pleased that there was only low
levels of
cross-talk here in the central region and the image looked good. The upper
region was clearer still and perhaps the timing could have been altered slightly
to move this clearer region down from the top to the centre perhaps? There was
no option for the user to change the strobe timing which would have an impact on
where this crosstalk appeared.
Gaming Comparisons
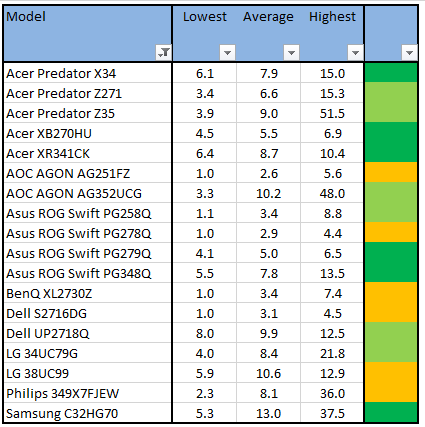
The above comparison table and graph shows you the
lowest, average and highest G2G response time measurement for each screen we
have tested with our oscilloscope system. There is also a colour coded mark next
to each screen in the table to indicate the RTC overshoot error, as the response
time figure alone doesn't tell the whole story.
These comparisons are based on the underlying
pixel response times, ignoring any motion clarity benefits of strobing
backlights etc. So on this screen the measurements were taken in the 'Standard'
response time mode, while the active refresh rate had no impact on the
measurements. With an average of 13ms G2G
the screen was quite slow, lagging behind the other models listed here - most of
which are gaming screens. Other competing VA technology screens like the AOC
AGON AG352UCG for instance were a little faster at 10.2ms G2G average, and in
fact had less of an overall problem with rise times and dark smearing than the
C32HG70. The native higher refresh rate IPS
models like the
Asus ROG Swift PG279Q
(5.0ms G2G) for
instance had performed much better, and TN Film models like the
Asus ROG Swift PG278Q
(2.9ms G2G) could of course reach faster speeds and are specifically designed
for gaming audiences.
Additional Gaming Features
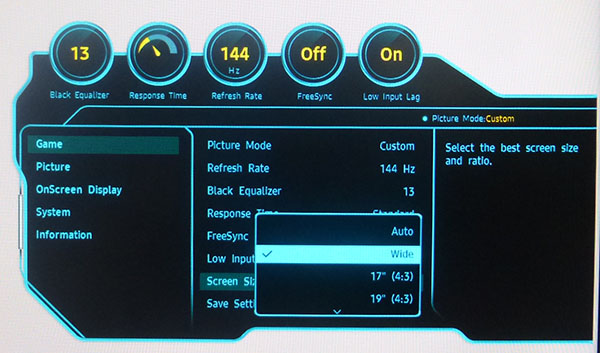
-
Aspect Ratio Control -
the screen offers 8 options for
aspect ratio control,
available through the OSD menu in the 'game' section as shown. There
are options for specific panel sizes (17" 4:3, 19" 4:3, 19" wide 16:10, 21.5"
wide 16:9, 22" wide 16:10 and 23" wide 16:9), wide and auto. The Auto mode is
handy as it will display the picture in the intended aspect ratio, while
filling as much of the screen as possible. It would have been useful to
include a 1:1 pixel mapping mode we felt for any unusual inputs, or if you
don't want to interpolate the image to a larger size using the 'auto' mode. It
was also missing a 5:4 aspect ratio mode option, despite the wide range of
specific sizes listed which were all in 4:3, 16:10 or 16:9 aspect.
-
Preset Modes -
There are 4 gaming preset modes
available in the menu. There are options for FPS, RTS, RPG and AOS modes. You
can also set up 3 user configurable modes and save them if you want which is
good. There's lots of flexibility here to set up specific modes for different
gaming needs, with and without features like the strobed backlight and
FreeSync modes on, depending on your requirements. Being able to quickly and
easily switch between them using the additional 3 buttons on the bottom edge
of the screen was handy.
-
Black Equalizer - There is a setting available in the 'game' section of
the OSD menu as pictured above which allows you to adjust the brightness of
the dark areas of games. We've seen this kind of feature on other screens
before and it can be handy where you are in a lot of dark environments to
bring out some shadow detail. Although the higher static contrast ratio of the
VA panel helps here too compared with other competing IPS and TN Film gaming
screens.
Lag
We have written an in depth article about
input lag and the various measurement techniques which are used to evaluate
this aspect of a display. It's important to first of all understand the
different methods available and also what this lag means to you as an end-user.
Input Lag vs. Display Lag vs. Signal
Processing
To avoid confusion with different terminology we
will refer to this section of our reviews as just "lag" from now on, as there
are a few different aspects to consider, and different interpretations of the
term "input lag". We will consider the following points here as much as
possible. The overall "display lag" is the first, that being the delay between
the image being shown on the TFT display and that being shown on a CRT. This is
what many people will know as input lag and originally was the measure made to
explain why the image is a little behind when using a CRT. The older stopwatch
based methods were the common way to measure this in the past, but through
advanced studies have been shown to be quite inaccurate. As a result, more
advanced tools like SMTT provide a method to measure that delay between a TFT
and CRT while removing the inaccuracies of older stopwatch methods.
In reality that lag / delay is caused by a
combination of two things - the signal processing delay caused by the TFT
electronics / scaler, and the response time of the pixels themselves. Most
"input lag" measurements over the years have always been based on the overall
display lag (signal processing + response time) and indeed the SMTT tool is
based on this visual difference between a CRT and TFT and so measures the
overall display lag. In practice the signal processing is the element which
gives the feel of lag to the user, and the response time of course can
impact blurring, and overall image quality in moving scenes. As people become
more aware of lag as a possible issue, we are of course keen to try and
understand the split between the two as much as possible to give a complete
picture.
The signal processing element within that is quite
hard to identify without extremely high end equipment and very complicated
methods. In fact the studies by Thomas Thiemann which really kicked this whole
thing off were based on equipment worth >100,1000 Euro, requiring extremely high
bandwidths and very complicated methods to trigger the correct behaviour and
accurately measure the signal processing on its own. Other techniques which are
being used since are not conducted by Thomas (he is a freelance writer) or based
on this equipment or technique, and may also be subject to other errors or
inaccuracies based on our conversations with him since. It's very hard as a
result to produce a technique which will measure just the signal processing on
its own unfortunately. Many measurement techniques are also not explained and so
it is important to try and get a picture from various sources if possible to
make an informed judgement about a display overall.
For our tests we will continue to use the SMTT
tool to measure the overall "display lag". From there we can use our
oscilloscope system to measure the response time across a wide range of grey to
grey (G2G) transitions as recorded in our
response time
tests. Since SMTT will not include the full response time within its
measurements, after speaking with Thomas further about the situation we will
subtract half of the average G2G response time from the total display lag. This should allow us to give a good estimation of
how much of the overall lag is attributable to the signal processing element on
its own.
Lag Classification
To help in this section we will also introduce a broader classification system
for these results to help categorise each screen as one of the following levels:
-
Class 1)
Less than 6.94ms / 1 frame lag at 144Hz - should be fine for gamers, even at high levels
-
Class
2)
A lag of 6.94 -
13.88ms / One to two frames at 144Hz - moderate lag but should be fine for many gamers.
Caution advised for serious gaming
-
Class
3)
A lag of more
than 13.88ms / more than 2 frames at 144Hz - Some noticeable lag in daily usage, not
suitable for high end gaming
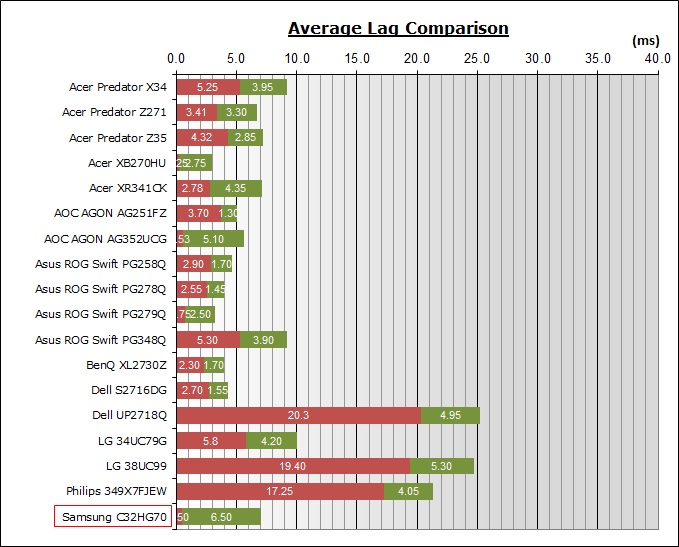
For the full reviews of the models compared here and the dates they were written
(and when screens were approximately released to the market), please see our
full
reviews index.
|
|
Low
Input Lag Mode |
|
(Measurements in ms) |
Off |
On |
|
Total Display Lag (SMTT
2) |
25.10 |
7.00 |
|
Pixel Response Time
Element |
6.50 |
6.50 |
|
Estimated Signal
Processing Lag |
18.60 |
0.50 |
|
Lag Classification |
3 |
1 |
|

Class
1 |
We have provided a comparison above against other
models we have tested to give an indication between screens. The screens
tested are split into two measurements which are
based on our overall display lag tests (using SMTT) and half the average G2G
response time, as measured by the oscilloscope. The response time is split from
the overall display lag and shown on the graph as the green bar. From there, the
signal processing (red bar) can be provided as a good estimation.
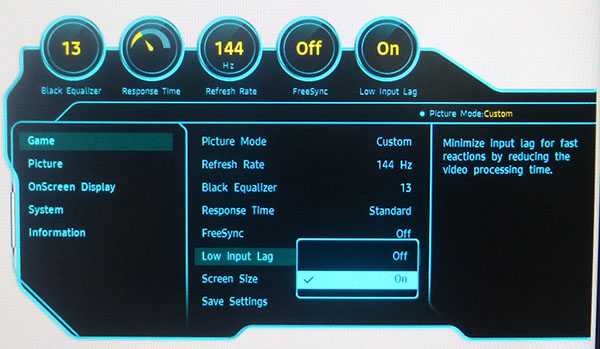
With Low Input lag mode turned off, the screen showed a total lag of
25.10ms as
measured by SMTT. If we take out an element related to pixel response times
(6.50ms) then we are left with an estimated signal processing lag of 18.6ms.
This is just under 3 frames at 144Hz (or just under 2 frames if you limit to
100Hz) and represents a quite high level of lag.
Thankfully the screen also features a 'low
input lag' mode in the OSD menu as shown above. This is available at all refresh
rates except 60Hz (for some reason). At 60Hz, that option is greyed out, this
includes when connecting external devices over HDMI. With low input lag mode
turned on we saw an excellent improvement in the lag. The total display lag from
SMTT measurements was now only 7.0ms, giving an estimated signal processing lag
of only 0.5ms. This is basically nothing and makes the screen suitable for a
wide range of gaming needs. A very good result there.
Movies and Video
The following summarises the screens performance
in video applications:
-
31.5"
screen size makes it a reasonable option for an all-in-one multimedia screen, but
being quite a bit smaller than most modern LCD TV's of course.
-
Curved screen format provides a level of immersion for movies and video, and
is popular in the TV market as well right now.
-
16:9 aspect ratio is more well suited to videos, and is a better format than
16:10 or 4:3 aspect screens. Ultrawide 21:9 aspect ratio options would be more
suitable though as they leave smaller borders on DVD's and wide
screen content at the top and bottom.
-
2560 x 1440 resolution can support full 1080 HD resolution content but is not
high enough to support Ultra HD 3840 x 2160 resolution natively without
scaling it down.
-
Digital interfaces support HDCP for any encrypted and protected content
-
Good range of modern connectivity options
provided with 1x DisplayPort 1.4 and 2x HDMI 2.0b offered.
-
Cables provided in
the box for DisplayPort and HDMI.
-
Light AG coating providing clean and clear images, without the unwanted
reflections of a glossy solution.
-
Wide brightness range adjustment possible from the display, including a
maximum luminance of ~357
cd/m2 and a fairly decent
minimum luminance of 21 cd/m2. This should afford you good control
for different lighting conditions. Brightness regulation is unfortunately controlled
using PWM and so is not flicker free which may be an issue to some users.
-
Black depth and contrast ratio are very good thanks to the VA panel at 2322:1
after calibration. Detail in darker scenes should not be lost as a result and
blacks look deep. It was not as strong as some other VA panels though (nearer
3000:1 being fairly common), and not in line with the 3000:1 spec typical from
Samsung
which was a shame. It fell more in line with the 'minimum' spec.
-
Extended colour space of around 127% sRGB thanks to the Quantum Dot coating,
which can give a bit of a
boost to colours making the screen appear a little more vivid. Not
too oversaturated like using a wide gamut screen would be but it helped make the
image a little more colourful we felt. This also allowed support for 93.6% of
the DCI-P3 reference space needed for HDR support.
-
There is a specific preset modes for 'cinema' on this model which made the
image slightly cooler than our calibrated custom mode. Might be useful to set
up for your movie viewing needs.
-
Fairly decent pixel responsiveness which should be able to handle fast moving scenes in
movies without much issue. You may see some dark smearing in some fast content
where the pixel response times are not fast enough to keep up.
-
Viewing angles are a little behind IPS
screens and there is a more noticeable gamma and colour tone shift as you change your
viewing position. The image becomes quite washed out. The viewing angles were
better here though than we'd seen from some other VA panels which was good
news and probably allows you to view the screen from different positions
without too much trouble.
-
A bit of backlight clouding was detected
along the top and bottom edges but it was not too bad. You may pick this out
sometimes when viewing movies where black
borders are present in these areas.
-
Good tilt and height adjustment range
available from the stand making it pretty easy to re-position the screen for
movie viewing from a distance, or with other people. They are quite stiff
so you won't want to move it around too much, but thankfully the side to side
swivel is easier and also handy for viewing from other positions.
-
There are no integrated stereo speakers on this model but there is a headphone output connection if
needed.
-
Good range of hardware aspect ratio control options available including an
'auto' mode to handle any non- 16:9 formats.
-
Picture in picture (PiP) and Picture By Picture (PbP) are not available on
this model.
HDR (High Dynamic Range)
HDR stands for High Dynamic Range and is a
technology just starting to make its way in to the desktop monitor market. It's
been around in the TV market for a couple of years and is used
primarily to provide a better dynamic range and contrast to the image for
multimedia, movies and games - that
being the difference between light and dark parts of an image. This improvement
to the dynamic range is usually
paired with other specific features under the banner term of "HDR" including a wider colour gamut for richer,
more vivid colours and specs like a 10-bit colour depth support and a high Ultra HD
resolution. Overall, an HDR Capable screen is designed to offer a more life-like
images, with better contrast ratios between light and dark areas and more vivid,
bright colours. You only need to go in to a high street store to observe the
difference that HDR makes on TV sets, so we would encourage you to do that if
you want to see first hand the improvements it makes to the image quality.
When you see the term HDR being used,
especially in the monitor market where it is still in its infancy, you need to
be aware that specs and performance will vary quite significantly. Our
detailed HDR article talks a lot more about the various technologies used,
including some standards which have been introduced to try and make HDR a little
less of a free-for-all. We will try and provide a brief summary of some of the
key HDR considerations and specs here in this review, while also looking at the
HDR performance of this screen in more detail.
HDR Content
Standards Support - HDR10
The
C32HG70 is designed to support the HDR10 content standard, which is one of the
two
main standards in the industry today. Dolby Vision is the other key alternative
and that is not supported on this screen as it does not carry the necessary
Dolby Vision chip or certification,
but HDR10 has been more widely adopted by the gaming hardware and software
studios which has helped establish its position. This includes by Microsoft for the
X Box One S and Sony for their PS4 and PS4 Pro consoles. How this content format
war settles is likely to take some time, but the HDR10 standard seems to be the
most likely to take hold in the monitor market for the time being.
Local Dimming Backlight - 8
Zone Edge Lit
On LCD displays, the static contrast ratio is
still limited by the panel technology being used. So for a TN Film or IPS
technology panel you are still limited by a contrast ratio of around 1000 -
1200:1, and on a VA type panel you might reach up to around 3000:1 or so. The
quite well established Ultra HD Premium standards in the TV market for HDR dictate that you need a contrast ratio of
>20,000:1 to conform to their specs. So how is this achieved from an LCD screen? The
answer is local dimming, operating a little bit like Dynamic Contrast Ratios (DCR)
of old. Rather than making the whole screen lighter or darker though depending
on the displayed content, local dimming attempts to dim only the dark parts of a
image, while making the light parts of the screen brighter. The result is a
localised dynamic contrast which greatly improves the picture quality and
dynamic range.
The effectiveness of this local dimming
depends on how the backlight is operated. The most basic HDR capable screens
might attempt this local dimming simply through edge-lit dimming where the panel
is backlit by LED's along the sides of the screen and split into a number of
zones. While you can do some level of dimming
through the adjustment of the edge-lit LED's it gives limited control over the
zones on a screen and its very tricky to pick out small areas effectively. A
better approach to achieving accurate and reliable local dimming is to provide a
backlight split in to hundreds of small zones behind the panel, where each zone is lit by a
small set of LEDs. The higher the number of zones the better, as it gives more
finite control over the image on the screen. Dark areas can be dimmed, while
bright areas are accentuated and made brighter.
Representation of edge-lit local dimming zones on the C32HG70
On the C32HG70 the local dimming is achieved
through an edge-lit backlight system. We were not able to officially confirm how many
dimming zones were in use, but 8 seems to be a fairly typical for edge lit
dimming and we expected that to be the number used here. In actual HDR tests it
became apparent that the backlight was split in this way, and you could see
individual zones light up as content changed. An indication of how the zones are
split on the C32HG70 is provided above.
This will not give the
same level of accuracy and control as a Full-Array-Local-Dimming (FALD)
backlight where several hundred zones directly behind the panel can control the
image in smaller areas. Even in those scenarios though you still need to keep in mind that the
screen is not being individually lit at a pixel level, and so there is still
some impact in varying the brightness of different zones. Depending on the content
shown on the screen, you may seem some "blooming", where the bright areas have a
halo or glow around them as zones bleed over in to one another. The smaller the
bright point on the screen, the more tricky it is to correctly light it in an
HDR environment without this blooming and haloing occurring. This blooming can
become even more noticeable the larger the zones are, especially with edge-lit
displays.
On the C32HG70 the limited number of zones
meant that you got some blooming around bright points on the screen, as larger
areas of the screen need to be controlled in one chunk. You could spot the
individual zones changing broadly on moving content and certain HDR tests. It's
hard to capture accurately to give you a visual representation here. It was not
a massive issue or super-obvious, but you just need to be aware that controlling
the screen through only a small number of zones has its limitations.
Ultra HD Premium Standard Conformity
|
Ultra HD
Premium Spec Guidelines
|
Yes/no
|
Display Spec
|
|
At least Ultra HD
Resolution 3840 x 2160 |
|
Quad HD 2560 x 1440 only |
|
10-bit colour depth
processing |
|
8-bit + FRC panel |
|
DCI-P3 colour space
coverage |
|
93.6% DCI-P3 measured |
|
Suitable HDR connectivity |
|
HDMI 2.0b and DisplayPort
1.4 |
|
at least 1000 cd/m2 peak luminance |
|
623 peak cd/m2 measured |
|
at least 20,000:1 active contrast ratio |
|
20,767:1 maximum measured |
|
|
|
Backlight dimming system
(not defined in Ultra HD Premium requirements) |
8 zone edge-lit local
dimming |
The
C32HG70 does not conform fully to the Ultra HD Premium definitions but offers a
pretty decent spec overall, meeting some of the requirements nonetheless.
Firstly the Ultra HD resolution is not supported here, with only 2560 x 1440
being offered. That is a necessary sacrifice at the moment to allow support for
the higher native refresh rates of 144Hz, and will not have any impact on the
dynamic range or colours of the screen of course, only the resolution and
sharpness. So the screen cannot truly display Ultra HD 3840 x 2160 resolution
content without scaling it down.
10-bit colour depth support is provided thanks to the 8-bit + FRC panel, again conforming to the
defined spec. From a PC you will need the relevant 10-bit workflow and graphics
card to work with 10-bit content, but from other output devices the 10-bit
support is there and ready to use - helping with colour range and gradation and
supporting the extended colour space.
Speaking of colour space, the Quantum Dot coated panel
allows for a high 93.6% (measured) coverage of the DCI-P3 reference space,
giving a respectable coverage of this reference space, and certainly helping to provide vivid and bright colours in HDR
content and multimedia. This is done without the need to use an expensive wide
gamut LED backlight which can really add to the retail cost of the screen, as
well as impact other areas like power consumption.
Connectivity wise the screen provides two different HDR compatible interface
options. DisplayPort 1.4 for very modern and future graphics cards will support
HDR from a PC - as long as you line up all the necessary components and software
to achieve it. HDMI 2.0b will then also support HDR including from external
games consoles and Blu-ray players.
The
peak brightness of the display in HDR mode is rated at 600 cd/m2 which is about
2 times as high as many displays in the market (when comparing their maximum
brightness spec). This doesn't mean that the whole screen suddenly operates at
600 cd/m2 which would be uncomfortably bright. The C32HG70 has a normal
maximum brightness spec of 350 cd/m2, but in HDR it can
reach a 'peak brightness' of 600 cd/m2. This is the brightness achieved where
the lighter areas of the screen are increased during HDR content, producing a better active
contrast ratio. Samsung tell us that the lower peak brightness (than 1000 cd/m2) was actually a
preference here, since for close-up HDR PC gaming they felt that 1000 cd/m2
would just be too bright. It might be ok for an LCD TV where you are viewing
from a couple of metres away at least, but when you are as close to the screen
as you are when using a PC the 600 cd/m2 was more comfortable. We
will test that performance in the next section.
HDR
Luminance and Peak Brightness
In
a new set of tests we measured the luminance and contrast performance of the
screen in HDR mode in a variety of scenarios. A white box is displayed on the
screen which covers 1% of the overall screen size initially. This is designed
to show at several target luminance levels, starting at 100 and then changing to
400 and 1000 cd/m2 (and beyond if needed). We measure the actual
luminance of that white box to see how close to the target luminance the screen
actually performs at each step. When the screen reaches the maximum peak
luminance possible, we also measure the black depth of the screen at a point
furthest away from the white area. This can then allow us to calculate the HDR
active contrast ratio, the difference between the bright white area on screen, and the
dark black areas elsewhere.
This 1% white screen coverage is designed to give a rough representation of how
a small highlight area in HDR content might appear and work in normal
multimedia. The box then increases to a larger size, covering 4, 9, 25, 49 and
finally 100% of the screen area. This represents different sized areas of bright
content in HDR multimedia. Again those progressively larger boxes are shown at
the different luminance targets, and we measure the actual screen luminance
achieved for each.
|
White window size |
100 cd/m2 target |
400 cd/m2 target |
1000 cd/m2 target |
|
Peak luminance
(cd/m2) |
Min black depth
(cd/m2) |
HDR contrast (x:1) |
|
1% |
96 |
390 |
623 |
|
623 |
0.03 |
20,767 |
|
4% |
96 |
389 |
620 |
|
620 |
0.03 |
20,667 |
|
9% |
96 |
387 |
619 |
|
619 |
0.03 |
20,633 |
|
25% |
71 |
245 |
383 |
|
383 |
0.14 |
2,736 |
|
49% |
62 |
232 |
363 |
|
363 |
0.16 |
2,269 |
|
100% |
62 |
232 |
363 |
|
363 |
n/a |
n/a |
With
the smallest 1% screen area white point as a starting point you can see that the
luminance output of the screen was very close to the target at 100 and 400 cd/m2.
When the screen tries to show a 1000 cd/m2 white box, we capture the
peak luminance of the screen here since it is only capable of going up to around
600 cd/m2 according to the product spec. In fact we measured a peak
luminance on this display of 623 cd/m2, achieved when there is only a
small (1% in this example) bright area on an otherwise dark screen. With a peak
luminance of 623 cd/m2 we measured a black point on the same screen
of only 0.03 cd/m2. This gives rise to a HDR contrast ratio of
20,767:1. This is above the requirements for the Ultra HD Premium specifications
as well and is very high. There is a large difference between the brightly lit
white box, and the dark areas of the screen. We were pleased with the peak
luminance and resulting HDR contrast ratio, living up to the spec nicely.
This
performance is very similar then for some of the larger bright areas, including when the
screen shows a 4% and 9% bright area. When the bright area gets larger still (25%
coverage and above) the actual achieved luminance is under the target brightness
levels. For instance at 25% coverage, the 400 cd/m2 target box
actually has a luminance of only 245 cd/m2. Peak brightness is also
lower at 383 cd/m2, and the blacks are not quite a deep either at
0.14 cd/m2. This gives a contrast ratio of 2736:1 which is still
high, but obviously much lower. When there is a larger bright area on the screen
the backlight has trouble meeting the desired luminance output it seems. The
edge-lit local dimming has a harder time making the white parts brighter, and
making the black parts darker at the same time. With only 8 zones in action,
there is also some "blooming" where the backlight that is boosting the white
area bleeds over a little in to the black regions as well. This is unavoidable
on any zonal local dimming system, especially so with only 8 edge-lit zones. The
black areas are not quite as deep as they could be since the blooming is causing
them to be lighter.
HDR Settings
and Operation
The screen will automatically detect if you
are sending HDR content to it, and will display a small HDR label in the
information tab of the OSD menu to confirm. You need to enable the 'local
dimming' option (to either auto or on) for the HDR to function correctly, via
the 'system' section as shown above. This local dimming is not available when
you are using the 'faster' or 'fastest' response time modes which is what
controls the strobing backlight, so you are not able to play HDR content while
also using that system.
Using HDR Complexities
We
will repeat what we said in our recent
Dell UP2718Q review here as it's an important consideration you need to
make. We should touch on the complexities of
using HDR at this stage though, especially from a PC. It's actually quite
complicated to achieve an HDR output at the moment from a PC and something you
should be aware of before jumping straight in to a modern HDR screen.
You
will need to ensure you have a compatible Operating System for a start. The
latest Windows 10 versions for instance will support HDR, but from many systems
you will see some odd behaviour from your monitor when it is connected. The image looks dull
and washed out as a result of the OS forcing HDR on for everything. HDR content
should work fine (if you can achieve it - more in a moment!) and provide a
lovely experience with the high dynamic range and rich colours as intended.
However normal every day use looks wrong with the HDR option turned on. Windows
imposes a brightness limit of 100 cd/m2 on the screen so that bright
content like a Word Document or Excel file doesn't blind you with the full 1000
cd/m2 capability of the backlight. That has a direct impact on how
the eye perceives the colours, reducing how vivid and rich they would normally
look. It also attempts to map the common sRGB content to the wider gamut colour
space of the screen causing some further issues. Sadly Windows isn't capable at
the moment of
turning HDR on/off when it detects HDR content, so for now it's probably a case
of needing to toggle the option in the settings section (settings > display >
HDR and Advanced Color > off/on). Windows does seem to behave better when using
HDMI connectivity so you may have more luck connecting over that video
interface, where it seems to switch correctly between SDR and HDR content and
hopefully negate the need to switch HDR on and off in the Windows setting when
you want to use different content. This is not any fault of the display, and perhaps as HDR settles a bit more we will have better OS support
emerge.
That is a little fiddly in itself, but a current OS software limitation. The
other complexity of HDR content from a PC is graphics card support. The latest
NVIDIA and AMD cards will support HDR output and even offer the appropriate
DisplayPort 1.4 or HDMI 2.0a+ outputs you need. This will require you to purchase a
top end graphics card if you want the full HDR experience, and there are some
added complexities around streaming video content and protection which you might
want to read up on further. There are graphics cards now available to provide
that HDR option from a PC, but they are going to be expensive right now.
Finally, content support is another complex consideration from a PC. HDR movies
and video including those offered by streaming services like Netflix, Amazon
Prime and YouTube currently won't work properly from a PC due to complicated
protection issues. They are
designed to offer HDR content via their relevant apps direct from an HDR TV
where the self-contained nature of the hardware makes this easier. So
a lot of the HDR content provided by these streaming services is difficult or
impossible to view from a PC at the moment. Plugging
in an external Ultra HD Blu-ray player with HDR support is thankfully simpler as
you are removing all the complexities
of software and hardware there, as the HDR feature is part of the overall device
and solution.
PC
HDR gaming is a little simpler, if you can find a title which supports HDR
properly! There are not many HDR PC games around yet, and even those that
support HDR in the console market will not always have a PC HDR equivalent.
Obviously more will come in time, but it's a little limited at the time of
writing.
The other area to consider here is console
HDR gaming. Thankfully that part of the gaming market is a bit more mature, and
it's far simpler to achieve HDR thanks to the enclosed nature of the system - no
software, graphics card or OS limitations to worry about here. If you have a
console which can output HDR for gaming such as the PS4, PS4 Pro or X Box One S
then the monitor will support those over the HDMI 2.0a connection. The
screen conforms in part to Ultra HD Premium HDR specs as we've already mentioned and while
it won't fully support 3840 x 2160 Ultra HD resolution or the full 1000 cd/m2
peak brightness defined by the UltraHD Premium standards it does offer the
necessary DCI-P3 colour space coverage, 10-bit input support and relevant
connectivity options. Remember that for consoles you are limited to 60Hz refresh
rate so actually options like the low input lag and strobing backlight will not
be available here sadly.
None of these complexities are the fault of the display, and we should make it clear that the
C32HG70 is certainly capable in itself of some degree of HDR content support, and will be HDR-ready for
you in the future. You just need to be aware of the difficulties in actually
getting HDR working from the PC side of things right now and understand that it
might limit your uptake of HDR material as a consumer at the moment. The TV market
is a simpler space for HDR right now, but although HDR is now emerging in the
monitor market, the driving PC content side of things still needs time to catch
up and settle.
Conclusion
The C32HG70 provided a really wide range of
functions, options and extras to test and a really nice set of features for
gaming audiences. You had modern connectivity from HDMI 2.0b and DisplayPort
1.4, loads of gaming preset modes in the OSD menu, user-customisable modes,
black equalizer, good aspect ratio control, a strobed backlight, FreeSync
support, 144Hz maximum refresh rate, low input lag mode. The list goes on...
Obviously the screen is aimed at gamers and
on the most part it performs very well. There are some limitations in places so
it's not the complete package. The strobing backlight works very well, giving
decent improvements in motion clarity as you would hope for and a high luminance
as well to avoid overly dark gaming like some competing screens will produce. It
was a shame you could not alter the brightness a bit if you wanted to. Combined
with the high native 144Hz refresh rate, the FreeSync support is very useful for
those who have perhaps less powerful systems and will experience fluctuating
frame rates, especially at the lower end. While not offering a full Ultra HD
resolution, the bump from a common 1080p resolution to 1440p here is definitely
welcome for not just gaming, but more general uses as well. Low input lag mode
works really well and eliminates pretty much all the lag, although it's a bit of
a shame you couldn't use it at 60Hz. We're not sure why. HDR gaming is supported
and the screen does offer a pretty decent HDR spec. No, it doesn't quite meet
the 1000 cd/m2 peak brightness, and the lack of Ultra HD resolution can be
forgiven, but it does well in other areas. The Quantum Dot coating helps boost
the colour space nicely and provides a more vivid appearance to improve your
image. The 8-zone local dimming backlight is useful, producing peak brightness
as advertised, and high active HDR contrast ratios. Implementing a full-array
local dimming backlight is expensive (and difficult) so this was a reasonable
moderate HDR support for a more general, and lower-cost gaming screen.
The main issue from a gaming point of view
though was the response times. VA panels often have problems here, but the slow
rise times caused some issues. This led to black smearing on moving content,
particularly on darker backgrounds which you can't eliminate. The slow overall
response times also created a limitation with the refresh rate, making it less
than optimal to use the screen above about 100Hz. We hope that maybe Samsung can
tweak the overdrive control with a future firmware revision if possible as that
would really help in our opinion.
In non-gaming areas the other main draw-back
of the screen was the use of PWM for backlight dimming. This could put some
users off if they are susceptible to flicker or eye related issues. We were
however pleased with the pretty decent factory calibration, something you don't
really expect from a gaming screen. The contrast ratio was strong as you would
hope from a VA panel too and we were pleased with the wider colour gamut, while
still offering an sRGB emulation if you wanted. There was a good range of extra
features and while the stand did offer good adjustments, we found it a bit
restrictive as it was very deep.
The CHG70 models are an interesting new
range, and it's nice to see Samsung back in the gaming market with new screens.
If those response times could be improved somehow, that would make a big
difference overall to the screen but it still offers a nice all round
performance and some impressive features to be worthy of your consideration.
If you appreciate the review and enjoy reading and like our work, we would welcome a
donation
to the site to help us continue to make quality and detailed reviews for you.
|
Pros |
Cons |
|
Wide range of functions,
connections, features and extras especially for gaming |
Some slow response times
resulting in dark smearing on some content. Fairly typical of VA panels |
|
Strobing backlight helps
improve motion clarity and works well |
PWM used for backlight
modulation |
|
Decent factory
calibration and high VA contrast ratio |
Stand is a bit too deep
and could be better |
|
Check Pricing and Buy - Direct Links
|
|
Amazon
|
|
TFTCentral is a participant
in the Amazon Services LLC Associates Programme, an affiliate
advertising programme designed to provide a means for sites to earn
advertising fees by advertising and linking to Amazon.com, Amazon.co.uk,
Amazon.de, Amazon.ca and other Amazon stores worldwide. We also
participate in a similar scheme for Overclockers.co.uk. |